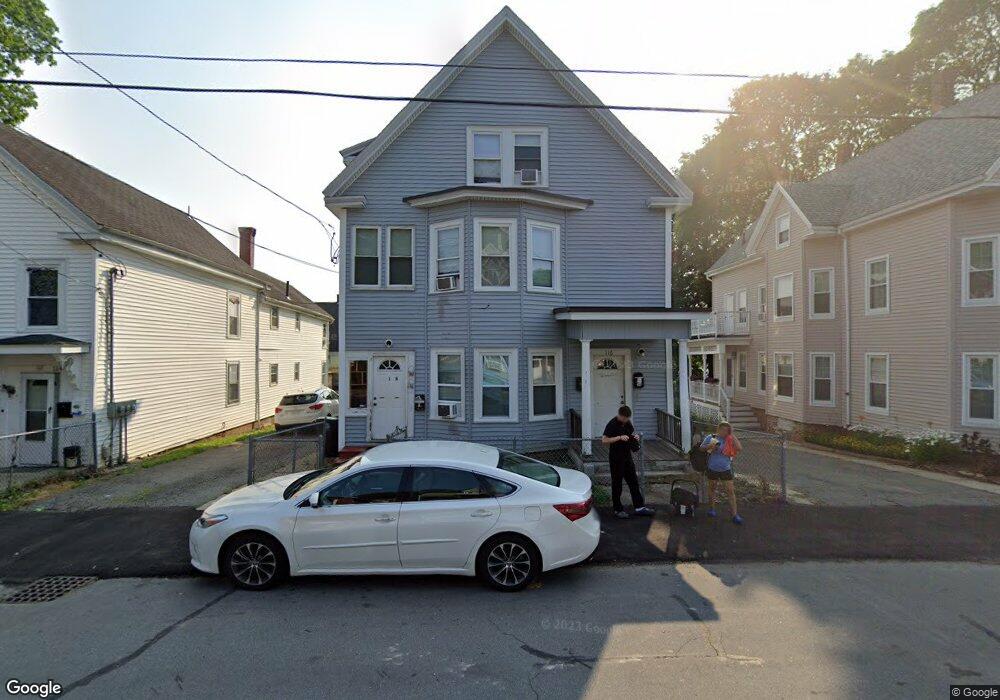
116 Cedar St Unit 2 Haverhill, MA 01830
Lower Acres NeighborhoodEstimated Value: $562,471 - $796,000
3
Beds
1
Bath
893
Sq Ft
$776/Sq Ft
Est. Value
About This Home
This home is located at 116 Cedar St Unit 2, Haverhill, MA 01830 and is currently estimated at $693,368, approximately $776 per square foot. 116 Cedar St Unit 2 is a home located in Essex County with nearby schools including Pentucket Lake Elementary School, John G. Whittier Middle School, and Haverhill High School.
Ownership History
Date
Name
Owned For
Owner Type
Purchase Details
Closed on
Feb 20, 2020
Sold by
Wilmington Svgs Fund Soc
Bought by
Farias Gildazio A
Current Estimated Value
Home Financials for this Owner
Home Financials are based on the most recent Mortgage that was taken out on this home.
Original Mortgage
$277,500
Outstanding Balance
$243,599
Interest Rate
3.6%
Mortgage Type
New Conventional
Estimated Equity
$449,769
Purchase Details
Closed on
Jul 23, 2019
Sold by
Block Capital Llc
Bought by
Wilmington Svgs Fund Soc
Purchase Details
Closed on
Sep 16, 2008
Sold by
Fhlmc
Bought by
Vargas Gerald J
Home Financials for this Owner
Home Financials are based on the most recent Mortgage that was taken out on this home.
Original Mortgage
$192,480
Interest Rate
6.58%
Mortgage Type
Purchase Money Mortgage
Purchase Details
Closed on
May 21, 2008
Sold by
Reedy Jeffrey S and Chase Home Finance Llc
Bought by
Fhlmc
Purchase Details
Closed on
Jan 12, 2006
Sold by
Pelletier Kevin D and Bower Patrick
Bought by
Reedy Jeffrey S and Reedy Lee Ann
Home Financials for this Owner
Home Financials are based on the most recent Mortgage that was taken out on this home.
Original Mortgage
$76,000
Interest Rate
6.28%
Mortgage Type
Purchase Money Mortgage
Purchase Details
Closed on
May 20, 2005
Sold by
116 Cedar T and 116 Foisy
Bought by
Pelletier Kevin D
Create a Home Valuation Report for This Property
The Home Valuation Report is an in-depth analysis detailing your home's value as well as a comparison with similar homes in the area
Home Values in the Area
Average Home Value in this Area
Purchase History
| Date | Buyer | Sale Price | Title Company |
|---|---|---|---|
| Farias Gildazio A | $370,000 | None Available | |
| Farias Gildazio A | $370,000 | None Available | |
| Wilmington Svgs Fund Soc | $86,880 | -- | |
| Vargas Gerald J | $185,000 | -- | |
| Fhlmc | $187,563 | -- | |
| Reedy Jeffrey S | $379,900 | -- | |
| Pelletier Kevin D | $182,500 | -- |
Source: Public Records
Mortgage History
| Date | Status | Borrower | Loan Amount |
|---|---|---|---|
| Open | Farias Gildazio A | $277,500 | |
| Closed | Farias Gildazio A | $277,500 | |
| Previous Owner | Pelletier Kevin D | $193,388 | |
| Previous Owner | Pelletier Kevin D | $192,480 | |
| Previous Owner | Pelletier Kevin D | $76,000 |
Source: Public Records
Tax History
| Year | Tax Paid | Tax Assessment Tax Assessment Total Assessment is a certain percentage of the fair market value that is determined by local assessors to be the total taxable value of land and additions on the property. | Land | Improvement |
|---|---|---|---|---|
| 2025 | $7,771 | $725,600 | $140,600 | $585,000 |
| 2024 | $6,889 | $647,500 | $139,100 | $508,400 |
| 2023 | $6,548 | $587,300 | $127,300 | $460,000 |
| 2022 | $6,182 | $486,000 | $115,400 | $370,600 |
| 2021 | $5,845 | $434,900 | $100,600 | $334,300 |
| 2020 | $5,584 | $410,600 | $93,200 | $317,400 |
| 2019 | $5,226 | $374,600 | $81,400 | $293,200 |
| 2018 | $5,000 | $350,600 | $77,000 | $273,600 |
| 2017 | $4,308 | $287,400 | $62,200 | $225,200 |
| 2016 | $3,951 | $257,200 | $62,200 | $195,000 |
| 2015 | $3,692 | $240,500 | $62,200 | $178,300 |
Source: Public Records
Map
Nearby Homes
- 19 Garden St Unit 19
- 10 8th Ave Unit 1
- 11 10th Ave
- 192 Franklin St
- 405 Main St Unit 6
- 33 Marshland St
- 12-14 Dover St
- 108 Harrison St
- 15 North St Unit 15
- 100 Lawrence St Unit 5
- 48 16th Ave
- 64 Harrison St
- 18 Pentucket St
- 32 Arlington St Unit 32
- 8 Vine St Unit 3
- 8 Vine St Unit 5
- 8 Vine St Unit 1
- 54 Highland Ave
- 3 Grand Ave Unit 2
- 29 Saltonstall Rd
Your Personal Tour Guide
Ask me questions while you tour the home.