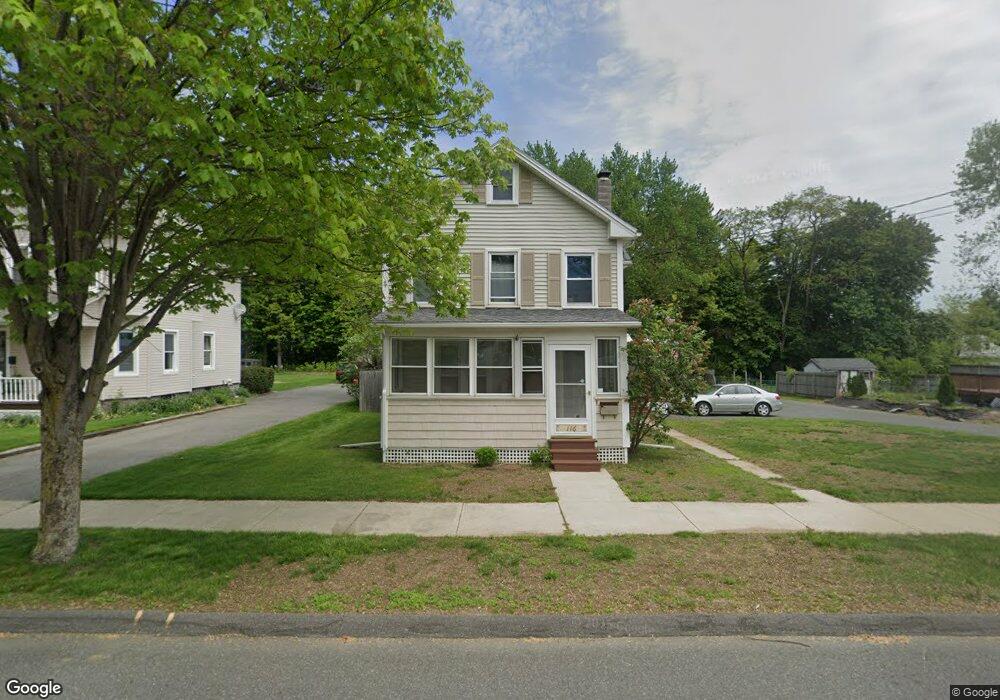
116 Chestnut St West Springfield, MA 01089
Estimated Value: $350,000 - $383,000
3
Beds
3
Baths
1,730
Sq Ft
$214/Sq Ft
Est. Value
About This Home
This home is located at 116 Chestnut St, West Springfield, MA 01089 and is currently estimated at $370,257, approximately $214 per square foot. 116 Chestnut St is a home located in Hampden County with nearby schools including West Springfield High School and St Thomas The Apostle School.
Ownership History
Date
Name
Owned For
Owner Type
Purchase Details
Closed on
Jul 31, 2013
Sold by
Dore Charles and Dore Elizabeth A
Bought by
Dore Craig
Current Estimated Value
Home Financials for this Owner
Home Financials are based on the most recent Mortgage that was taken out on this home.
Original Mortgage
$176,688
Outstanding Balance
$123,146
Interest Rate
3.95%
Mortgage Type
FHA
Estimated Equity
$247,111
Create a Home Valuation Report for This Property
The Home Valuation Report is an in-depth analysis detailing your home's value as well as a comparison with similar homes in the area
Home Values in the Area
Average Home Value in this Area
Purchase History
We collect this data history from publicly available records. To have your information removed, we recommend requesting removal directly through your county’s website.
| Date | Buyer | Sale Price | Title Company |
|---|---|---|---|
| Dore Craig | $192,500 | -- | |
| Dore Craig A | $192,500 | -- | |
| Dore Craig A | $192,500 | -- |
Source: Public Records
Mortgage History
We collect this data history from publicly available records. To have your information removed, we recommend requesting removal directly through your county’s website.
| Date | Status | Borrower | Loan Amount |
|---|---|---|---|
| Open | Dore Craig A | $176,688 | |
| Closed | Dore Craig A | $176,688 | |
| Previous Owner | Dore Craig | $174,000 |
Source: Public Records
Tax History
| Year | Tax Paid | Tax Assessment Tax Assessment Total Assessment is a certain percentage of the fair market value that is determined by local assessors to be the total taxable value of land and additions on the property. | Land | Improvement |
|---|---|---|---|---|
| 2025 | $4,708 | $316,600 | $102,500 | $214,100 |
| 2024 | $4,430 | $299,100 | $102,500 | $196,600 |
| 2023 | $4,168 | $268,200 | $100,300 | $167,900 |
| 2022 | $3,776 | $239,600 | $90,900 | $148,700 |
| 2021 | $3,324 | $196,700 | $85,100 | $111,600 |
| 2020 | $3,337 | $196,400 | $85,100 | $111,300 |
| 2019 | $3,331 | $196,400 | $85,100 | $111,300 |
| 2018 | $3,349 | $196,400 | $85,100 | $111,300 |
| 2017 | $3,349 | $196,400 | $85,100 | $111,300 |
| 2016 | $3,250 | $191,300 | $80,000 | $111,300 |
| 2015 | $3,187 | $187,600 | $78,400 | $109,200 |
| 2014 | $771 | $187,100 | $78,400 | $108,700 |
Source: Public Records
Map
Nearby Homes
- 100 Chestnut St
- 122 Chestnut St
- 106 Chestnut St
- 106 Chestnut St Unit 1
- 130 Chestnut St
- 105 Chestnut St Unit 105
- 111 Chestnut St
- 121 Chestnut St Unit 121
- 107 Chestnut St
- 134 Maple St
- 119 Chestnut St
- 119 Chestnut St Unit 119 Chestnut ST
- 94 Chestnut St
- 94 Chestnut St Unit 1st Fl
- 99 Chestnut St
- 99 Chestnut St Unit 1
- 126 Maple St
- 131 Hillside Ave
- 129 Chestnut St
- 133 Hillside Ave
Your Personal Tour Guide
Ask me questions while you tour the home.