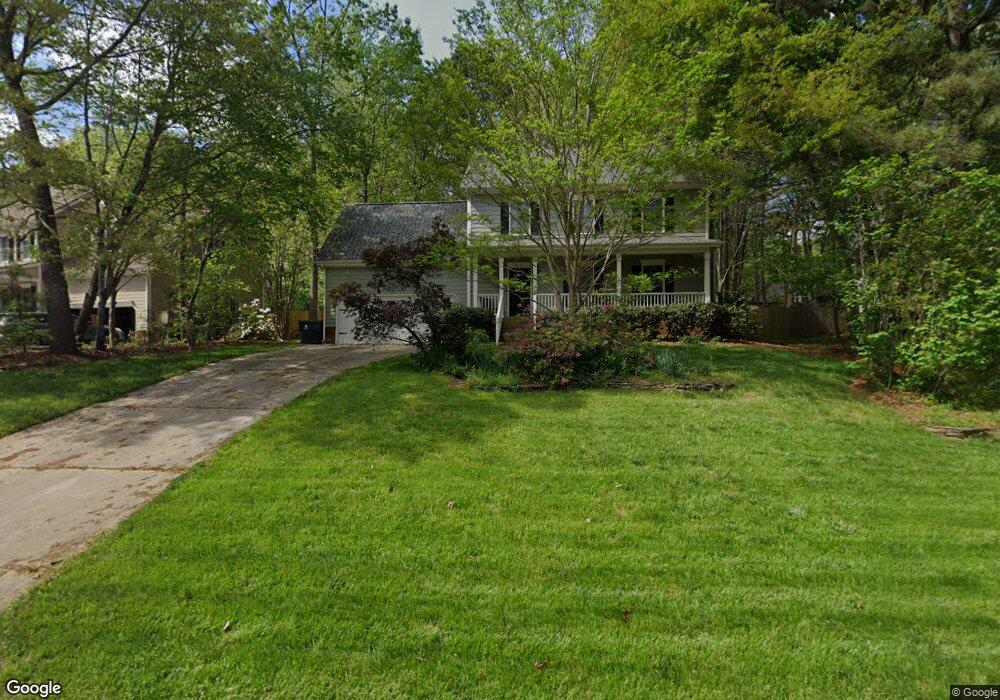
116 Clay Ridge Way Holly Springs, NC 27540
Estimated Value: $488,000 - $524,000
32
Beds
3
Baths
2,038
Sq Ft
$249/Sq Ft
Est. Value
About This Home
This home is located at 116 Clay Ridge Way, Holly Springs, NC 27540 and is currently estimated at $507,027, approximately $248 per square foot. 116 Clay Ridge Way is a home located in Wake County with nearby schools including Oakview Elementary School, Apex Friendship Middle School, and Holly Springs High School.
Ownership History
Date
Name
Owned For
Owner Type
Purchase Details
Closed on
Jun 12, 1998
Sold by
Blackley Building Inc
Bought by
Swanson Dean S and Swanson Valerie J
Current Estimated Value
Home Financials for this Owner
Home Financials are based on the most recent Mortgage that was taken out on this home.
Original Mortgage
$135,500
Outstanding Balance
$27,533
Interest Rate
7.23%
Estimated Equity
$479,494
Purchase Details
Closed on
Nov 18, 1997
Sold by
Sol Inc
Bought by
Blackley Building Inc
Home Financials for this Owner
Home Financials are based on the most recent Mortgage that was taken out on this home.
Original Mortgage
$32,855
Interest Rate
7.27%
Create a Home Valuation Report for This Property
The Home Valuation Report is an in-depth analysis detailing your home's value as well as a comparison with similar homes in the area
Home Values in the Area
Average Home Value in this Area
Purchase History
| Date | Buyer | Sale Price | Title Company |
|---|---|---|---|
| Swanson Dean S | $169,500 | -- | |
| Blackley Building Inc | $31,000 | -- |
Source: Public Records
Mortgage History
| Date | Status | Borrower | Loan Amount |
|---|---|---|---|
| Open | Swanson Dean S | $135,500 | |
| Previous Owner | Blackley Building Inc | $32,855 | |
| Closed | Swanson Dean S | $10,000 |
Source: Public Records
Tax History Compared to Growth
Tax History
| Year | Tax Paid | Tax Assessment Tax Assessment Total Assessment is a certain percentage of the fair market value that is determined by local assessors to be the total taxable value of land and additions on the property. | Land | Improvement |
|---|---|---|---|---|
| 2025 | $4,314 | $499,004 | $125,000 | $374,004 |
| 2024 | $4,296 | $499,004 | $125,000 | $374,004 |
| 2023 | $3,288 | $303,023 | $65,000 | $238,023 |
| 2022 | $3,175 | $303,023 | $65,000 | $238,023 |
| 2021 | $3,116 | $303,023 | $65,000 | $238,023 |
| 2020 | $3,116 | $303,023 | $65,000 | $238,023 |
| 2019 | $2,997 | $247,427 | $60,000 | $187,427 |
| 2018 | $2,709 | $247,427 | $60,000 | $187,427 |
| 2017 | $2,612 | $247,427 | $60,000 | $187,427 |
| 2016 | $2,576 | $247,427 | $60,000 | $187,427 |
| 2015 | $2,511 | $237,321 | $48,000 | $189,321 |
| 2014 | $2,424 | $237,321 | $48,000 | $189,321 |
Source: Public Records
Map
Nearby Homes
- 321 Cross Hill Ln
- 105 Cross Hill Ln
- 225 Douglas St
- 124 Cliffdale Rd
- 112 Burt St
- 224 Hartshorn Ct
- 104 Chilmark Ridge Dr
- 405 W Ballentine St
- 737 W Holly Springs Rd
- 743 W Holly Springs Rd
- 749 W Holly Springs Rd
- 755 W Holly Springs Rd
- 761 W Holly Springs Rd
- 108 Crabwall Ct
- 321 Blalock St
- 220 Avent Ferry Rd
- 717 Starkland Way
- 713 Littleleaf Ct
- 105 Townsgate Ct
- 401 Vista Springs Cir
- 112 Clay Ridge Way
- 120 Clay Ridge Way
- 108 Clay Ridge Way
- 124 Clay Ridge Way
- 216 Dutch Hill Rd
- 220 Dutch Hill Rd
- 212 Dutch Hill Rd
- 224 Dutch Hill Rd
- 128 Clay Ridge Way
- 104 Clay Ridge Way
- 117 Clay Ridge Way
- 208 Dutch Hill Rd
- 105 Clay Ridge Way
- 113 Clay Ridge Way
- 109 Clay Ridge Way
- 228 Dutch Hill Rd
- 125 Clay Ridge Way
- 132 Clay Ridge Way
- 204 Dutch Hill Rd
- 113 Bottle Neck Trail