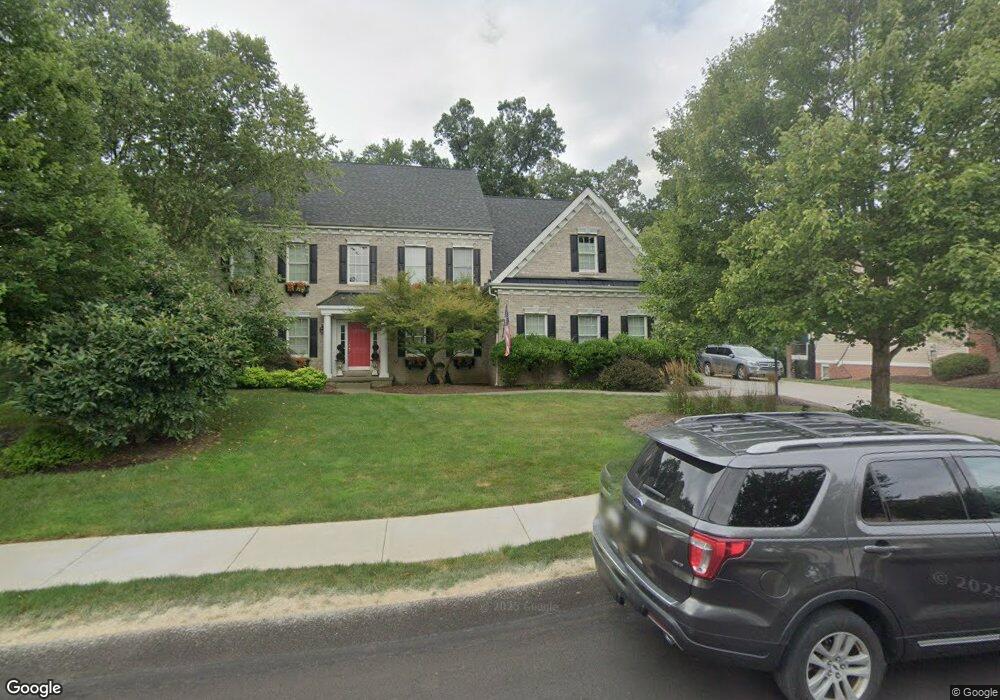
116 Clover Ln Gibsonia, PA 15044
Estimated Value: $1,011,000 - $1,208,000
4
Beds
4
Baths
4,545
Sq Ft
$239/Sq Ft
Est. Value
About This Home
This home is located at 116 Clover Ln, Gibsonia, PA 15044 and is currently estimated at $1,085,880, approximately $238 per square foot. 116 Clover Ln is a home located in Allegheny County with nearby schools including Eden Hall Upper Elementary, Richland Elementary School, and Pine-Richland Middle School.
Ownership History
Date
Name
Owned For
Owner Type
Purchase Details
Closed on
Jan 12, 2010
Sold by
Heartland Homes Inc
Bought by
Casey Kevin M and Casey Samantha J
Current Estimated Value
Home Financials for this Owner
Home Financials are based on the most recent Mortgage that was taken out on this home.
Original Mortgage
$390,000
Outstanding Balance
$253,970
Interest Rate
4.79%
Mortgage Type
New Conventional
Estimated Equity
$831,910
Purchase Details
Closed on
Jul 16, 2009
Sold by
Stonecrest Assoc L L C
Bought by
Heartland Homes Inc
Create a Home Valuation Report for This Property
The Home Valuation Report is an in-depth analysis detailing your home's value as well as a comparison with similar homes in the area
Home Values in the Area
Average Home Value in this Area
Purchase History
| Date | Buyer | Sale Price | Title Company |
|---|---|---|---|
| Casey Kevin M | $561,124 | -- | |
| Heartland Homes Inc | $120,000 | -- |
Source: Public Records
Mortgage History
| Date | Status | Borrower | Loan Amount |
|---|---|---|---|
| Open | Casey Kevin M | $390,000 |
Source: Public Records
Tax History
| Year | Tax Paid | Tax Assessment Tax Assessment Total Assessment is a certain percentage of the fair market value that is determined by local assessors to be the total taxable value of land and additions on the property. | Land | Improvement |
|---|---|---|---|---|
| 2025 | $13,759 | $543,500 | $102,900 | $440,600 |
| 2024 | $13,759 | $543,500 | $102,900 | $440,600 |
| 2023 | $13,759 | $543,500 | $102,900 | $440,600 |
| 2022 | $13,759 | $543,500 | $102,900 | $440,600 |
| 2021 | $2,571 | $543,500 | $102,900 | $440,600 |
| 2020 | $13,759 | $543,500 | $102,900 | $440,600 |
| 2019 | $13,759 | $543,500 | $102,900 | $440,600 |
| 2017 | $13,553 | $543,500 | $102,900 | $440,600 |
Source: Public Records
Map
Nearby Homes
- 120 Timothy Rd
- 3024 Spruce Rd
- 4108 Spruce Rd
- 131 Birch Dr
- 7406 Chestnut Way
- 2013 Cherry Rd
- 2015 Cherry Rd
- 5103 Spruce Rd
- 1039 S Lake Dr
- 690 Pearce Mill Rd
- 2017 Condor Ln
- (Lot 133) 310 Mccutcheon Ct
- 300 Mccutcheon Ct
- (Lot 115) 557 Macleod Dr
- (Lot 323) 214 Macfadden Dr
- 109 Rabold Dr
- 503 Cambridge Ct
- 223 Fox Meadow Dr
- 115 Lyndhurst Cir
- 124 Fox Meadow Dr