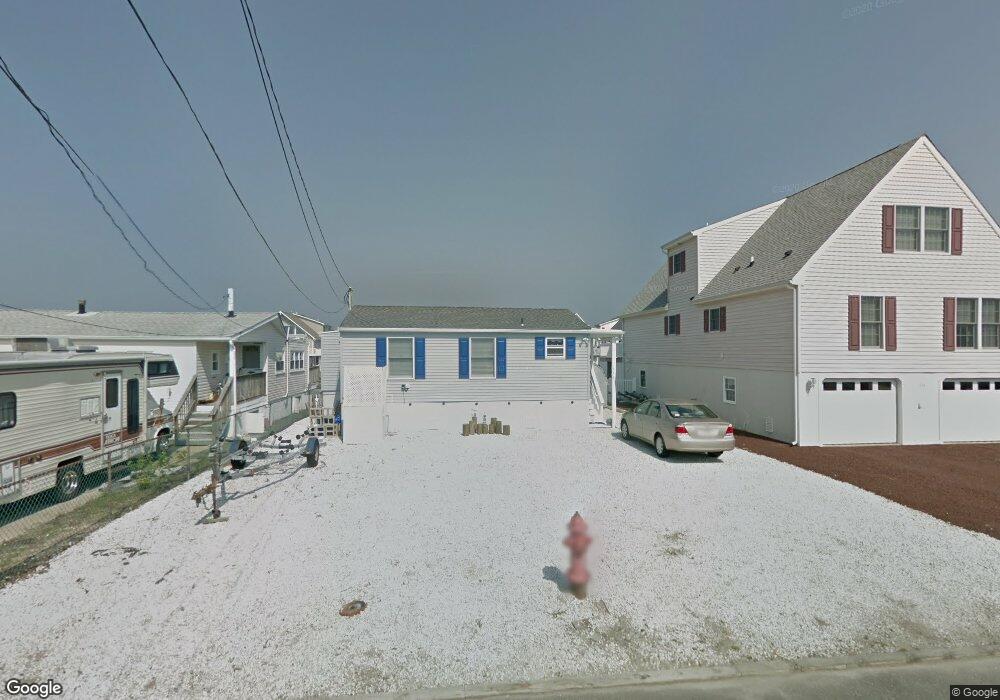
116 Curlew Rd Tuckerton, NJ 08087
Estimated Value: $390,628 - $517,000
2
Beds
1
Bath
748
Sq Ft
$619/Sq Ft
Est. Value
About This Home
This home is located at 116 Curlew Rd, Tuckerton, NJ 08087 and is currently estimated at $462,907, approximately $618 per square foot. 116 Curlew Rd is a home located in Ocean County with nearby schools including Tuckerton Elementary School, Pinelands Regional Junior High School, and Pinelands Regional High School.
Ownership History
Date
Name
Owned For
Owner Type
Purchase Details
Closed on
Feb 14, 2024
Sold by
Bennett Brianna
Bought by
Antonello Anthony and Antonello Sheona
Current Estimated Value
Home Financials for this Owner
Home Financials are based on the most recent Mortgage that was taken out on this home.
Original Mortgage
$254,900
Outstanding Balance
$250,437
Interest Rate
6.66%
Mortgage Type
New Conventional
Estimated Equity
$212,470
Purchase Details
Closed on
Aug 14, 2017
Sold by
Bennett Helen
Bought by
Bennett Brianna
Purchase Details
Closed on
Jul 27, 2007
Sold by
Moran Mark and Moran Donna
Bought by
Casserly Charles T and Casserly Alice M
Home Financials for this Owner
Home Financials are based on the most recent Mortgage that was taken out on this home.
Original Mortgage
$233,000
Interest Rate
6.67%
Mortgage Type
Purchase Money Mortgage
Purchase Details
Closed on
Nov 27, 2002
Sold by
Spano Phyllis
Bought by
Calabro Thomas and Calabro Elizabeth
Create a Home Valuation Report for This Property
The Home Valuation Report is an in-depth analysis detailing your home's value as well as a comparison with similar homes in the area
Home Values in the Area
Average Home Value in this Area
Purchase History
| Date | Buyer | Sale Price | Title Company |
|---|---|---|---|
| Antonello Anthony | $339,900 | Stewart Title | |
| Antonello Anthony | $339,900 | Stewart Title | |
| Bennett Brianna | -- | -- | |
| Casserly Charles T | $330,000 | Independence Abstract & Titl | |
| Calabro Thomas | $157,500 | -- |
Source: Public Records
Mortgage History
| Date | Status | Borrower | Loan Amount |
|---|---|---|---|
| Open | Antonello Anthony | $254,900 | |
| Closed | Antonello Anthony | $254,900 | |
| Previous Owner | Casserly Charles T | $233,000 |
Source: Public Records
Tax History Compared to Growth
Tax History
| Year | Tax Paid | Tax Assessment Tax Assessment Total Assessment is a certain percentage of the fair market value that is determined by local assessors to be the total taxable value of land and additions on the property. | Land | Improvement |
|---|---|---|---|---|
| 2025 | $4,861 | $156,900 | $97,600 | $59,300 |
| 2024 | $4,428 | $156,900 | $97,600 | $59,300 |
| 2023 | $4,018 | $156,900 | $97,600 | $59,300 |
| 2022 | $4,018 | $152,100 | $92,800 | $59,300 |
| 2021 | $3,947 | $152,100 | $92,800 | $59,300 |
| 2020 | $3,985 | $152,100 | $92,800 | $59,300 |
| 2019 | $3,977 | $152,100 | $92,800 | $59,300 |
| 2018 | $5,653 | $221,600 | $160,000 | $61,600 |
| 2017 | $5,389 | $221,600 | $160,000 | $61,600 |
| 2016 | $4,608 | $221,600 | $160,000 | $61,600 |
| 2015 | $4,546 | $221,600 | $160,000 | $61,600 |
| 2014 | $4,515 | $221,600 | $160,000 | $61,600 |
Source: Public Records
Map
Nearby Homes
- 112 Curlew Rd
- 186 Flamingo Rd
- 73 Little Egg Harbor Blvd
- 163 Flamingo Rd
- 348 Kingfisher Rd
- 389 Kingfisher Rd
- 233 Heron Rd
- 370 Kingfisher Rd
- 1019 S Green St
- 267 Heron Rd
- 27 Parker Rd
- 25 Carroll Ave
- 79 Dolphin Rd
- 604 S Green St
- 476 S Green St
- 56 Flax Isle Dr
- 5 Hunter Dr
- 67 Flax Isle Dr
- 10 Sea Isle Dr
- 40 Daddy Tucker Dr