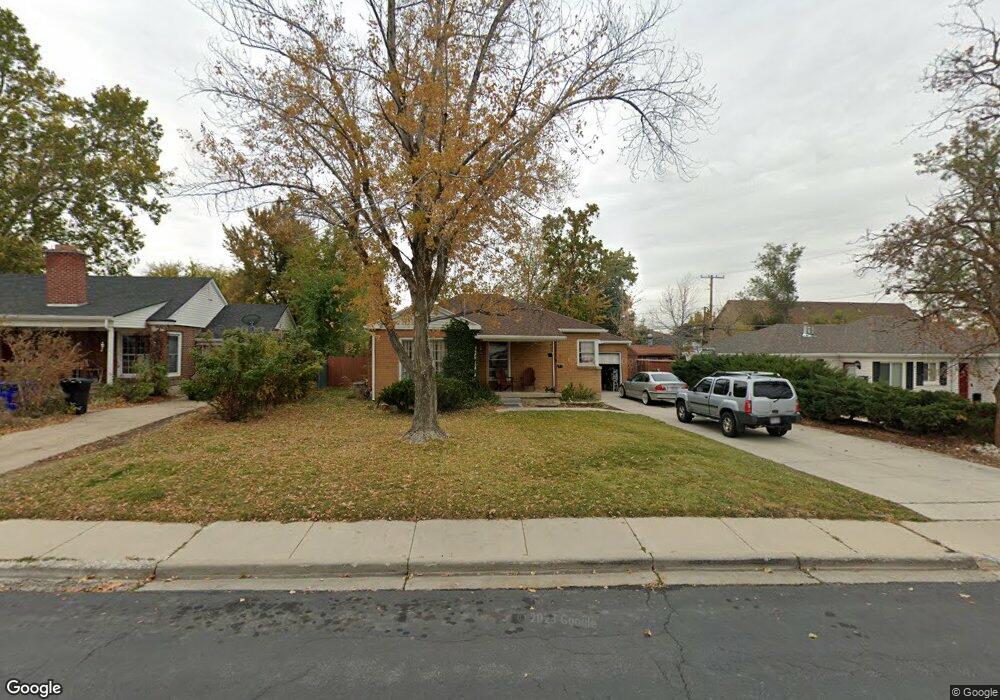
116 E 650 N Bountiful, UT 84010
Estimated Value: $434,000 - $584,000
3
Beds
1
Bath
916
Sq Ft
$524/Sq Ft
Est. Value
About This Home
This home is located at 116 E 650 N, Bountiful, UT 84010 and is currently estimated at $480,064, approximately $524 per square foot. 116 E 650 N is a home located in Davis County with nearby schools including Tolman School, Bountiful Junior High School, and Viewmont High School.
Ownership History
Date
Name
Owned For
Owner Type
Purchase Details
Closed on
Mar 6, 2023
Sold by
Porter Family Trust
Bought by
Carolyn And Larry Porter Irrevocable Trust
Current Estimated Value
Purchase Details
Closed on
Jan 10, 2001
Sold by
Porter Larry Lynn
Bought by
Porter Larry L and Porter Carolyn B
Purchase Details
Closed on
Dec 19, 2000
Sold by
Porter Larry Lynn
Bought by
Porter Larry L and Porter Carolyn B
Purchase Details
Closed on
Dec 13, 1999
Sold by
Porter Larry Lynn
Bought by
Porter Larry L and Porter Carolyn D
Purchase Details
Closed on
Dec 11, 1998
Sold by
Porter Larry Lynn
Bought by
Porter Larry L and Porter Carolyn B
Purchase Details
Closed on
May 30, 1997
Sold by
Porter Larry Lynn
Bought by
Porter Larry L and Porter Carolyn B
Purchase Details
Closed on
Nov 15, 1996
Sold by
Porter Larry Lynn
Bought by
Porter Larry L and Porter Carolyn B
Create a Home Valuation Report for This Property
The Home Valuation Report is an in-depth analysis detailing your home's value as well as a comparison with similar homes in the area
Purchase History
| Date | Buyer | Sale Price | Title Company |
|---|---|---|---|
| Carolyn And Larry Porter Irrevocable Trust | -- | None Listed On Document | |
| Porter Larry L | -- | -- | |
| Porter Larry L | -- | -- | |
| Porter Larry L | -- | -- | |
| Porter Larry L | -- | -- | |
| Porter Larry L | -- | -- | |
| Porter Larry L | -- | -- | |
| Porter Larry L | -- | -- |
Source: Public Records
Tax History
| Year | Tax Paid | Tax Assessment Tax Assessment Total Assessment is a certain percentage of the fair market value that is determined by local assessors to be the total taxable value of land and additions on the property. | Land | Improvement |
|---|---|---|---|---|
| 2025 | $2,815 | $251,900 | $137,586 | $114,314 |
| 2024 | $2,636 | $245,299 | $124,546 | $120,753 |
| 2023 | $2,501 | $232,100 | $125,217 | $106,882 |
| 2022 | $2,537 | $427,000 | $225,319 | $201,681 |
| 2021 | $2,132 | $300,000 | $162,248 | $137,752 |
| 2020 | $1,890 | $266,000 | $137,945 | $128,055 |
| 2019 | $1,872 | $257,000 | $141,335 | $115,665 |
| 2018 | $1,717 | $231,000 | $138,746 | $92,254 |
| 2016 | $1,619 | $118,965 | $59,029 | $59,936 |
| 2015 | $1,637 | $113,850 | $59,029 | $54,821 |
| 2014 | $1,465 | $104,020 | $59,029 | $44,991 |
| 2013 | -- | $96,260 | $43,945 | $52,315 |
Source: Public Records
Map
Nearby Homes
- 17 E 400 N Unit 19B
- 453 N 400 E Unit 7-D
- 978 N 170 E
- 513 N 400 E Unit 14B
- 49 E 200 N Unit 4
- 41 E 200 N Unit 6
- 252 N Main St
- 256 N Main St
- 254 N Main St
- 55 E 200 N Unit 2
- 51 E 200 N Unit 3
- 214 E 1250 N
- 320 N 200 W Unit 4
- 499 N 200 W Unit 30
- 499 N 200 W Unit 19
- 563 N 200 W
- 1130 N 200 W
- 332 N 300 W
- 1420 N Main St
- 1260 N 200 W
- 128 E 650 N
- 127 E 550 N
- 125 E 550 N
- 135 E 550 N
- 115 E 550 N
- 630 N Main St
- 150 E 650 N
- 650 N Main St Unit 1207
- 650 N Main St Unit 9104
- 650 N Main St
- 115 E 650 N
- 145 E 550 N
- 125 E 650 N
- 103 E 650 N
- 592 N Main St
- 592 N Main St
- 592 N Main St
- 592 N Main St Unit 3
- 592 N Main St Unit 2
- 592 N Main St Unit 1
Your Personal Tour Guide
Ask me questions while you tour the home.