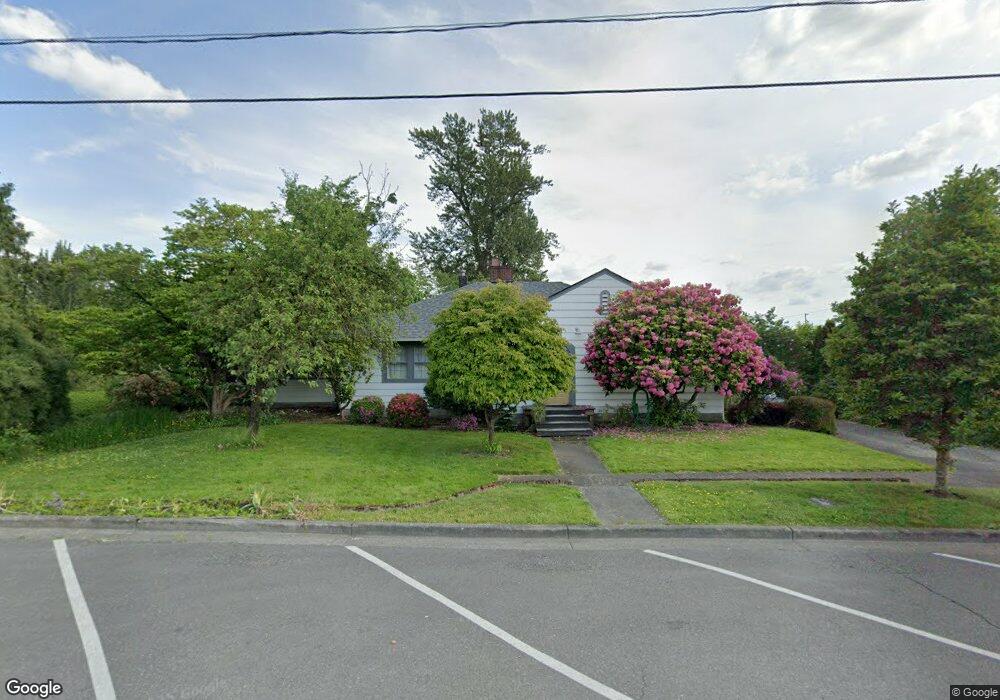
116 E Front St Lynden, WA 98264
Estimated Value: $572,298 - $756,000
3
Beds
2
Baths
1,914
Sq Ft
$356/Sq Ft
Est. Value
About This Home
This home is located at 116 E Front St, Lynden, WA 98264 and is currently estimated at $681,825, approximately $356 per square foot. 116 E Front St is a home located in Whatcom County with nearby schools including Lynden High School, Lynden Christian School, and Lynden Christian Schools: Administration.
Ownership History
Date
Name
Owned For
Owner Type
Purchase Details
Closed on
Sep 21, 2000
Sold by
Hickey Mark B and Hickey Tracy A
Bought by
Roosendaal James M and Roosendaal Kristine M
Current Estimated Value
Home Financials for this Owner
Home Financials are based on the most recent Mortgage that was taken out on this home.
Original Mortgage
$160,000
Outstanding Balance
$54,996
Interest Rate
8.07%
Estimated Equity
$626,829
Create a Home Valuation Report for This Property
The Home Valuation Report is an in-depth analysis detailing your home's value as well as a comparison with similar homes in the area
Home Values in the Area
Average Home Value in this Area
Purchase History
| Date | Buyer | Sale Price | Title Company |
|---|---|---|---|
| Roosendaal James M | $200,000 | Whatcom Land Title |
Source: Public Records
Mortgage History
| Date | Status | Borrower | Loan Amount |
|---|---|---|---|
| Open | Roosendaal James M | $160,000 |
Source: Public Records
Tax History
| Year | Tax Paid | Tax Assessment Tax Assessment Total Assessment is a certain percentage of the fair market value that is determined by local assessors to be the total taxable value of land and additions on the property. | Land | Improvement |
|---|---|---|---|---|
| 2025 | $4,380 | $597,362 | $270,097 | $327,265 |
| 2024 | $4,113 | $577,461 | $240,075 | $337,386 |
| 2023 | $4,113 | $571,910 | $247,500 | $324,410 |
| 2022 | $3,391 | $444,713 | $162,459 | $282,254 |
| 2021 | $3,326 | $367,527 | $134,262 | $233,265 |
| 2020 | $2,914 | $328,158 | $119,880 | $208,278 |
| 2019 | $2,593 | $300,992 | $110,070 | $190,922 |
| 2018 | $2,833 | $274,475 | $100,269 | $174,206 |
| 2017 | $2,564 | $246,365 | $90,000 | $156,365 |
| 2016 | $2,427 | $237,147 | $90,200 | $146,947 |
| 2015 | $2,152 | $223,221 | $86,756 | $136,465 |
| 2014 | -- | $215,654 | $83,804 | $131,850 |
| 2013 | -- | $213,850 | $82,000 | $131,850 |
Source: Public Records
Map
Nearby Homes
- 212 E Grover St
- 214 E Grover St
- 208 Skipping Stone Loop
- 223 Judson St Unit 201
- 214 Skipping Stone Loop
- 204 Skipping Stone Loop
- 120 Skipping Stone Loop
- 211 Maple St
- 208 Riverwalk Dr
- 102 Riverwalk Dr
- 116 Riverwalk Dr
- 220 Skipping Stone Loop
- 104 Riverwalk Dr
- 231 Skipping Stone Loop
- 204 Pebblebrook Dr
- 212 Riverwalk Dr
- 211 Pebblebrook Dr
- 208 Pebblebrook Dr
- 701 E Grover St
- 303 Parkside Ct
- 108 E Front St
- 117 E Front St
- 125 E Front St
- 113 E Front St
- 109 E Front St
- 100 E Front St
- 107 S 1st St
- 101 E Front St
- 126 E Grover St Unit 5A
- 126 E Grover St Unit 8
- 126 E Grover St Unit 7
- 126 E Grover St Unit 5
- 117 S 1st St
- 124 E Grover St Unit 4
- 124 E Grover St Unit 3
- 124 E Grover St Unit 2
- 124 E Grover St Unit 1
- 124 E Grover St Unit 3C
- 101 Front St
- 112 E Grover St
Your Personal Tour Guide
Ask me questions while you tour the home.