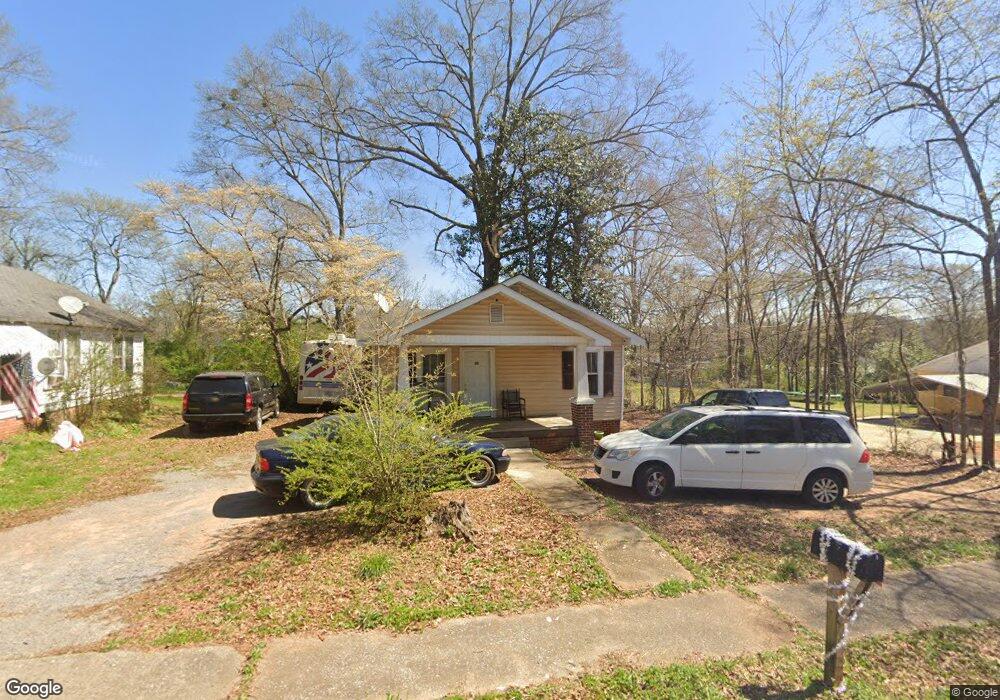
116 Elizabeth St Cedartown, GA 30125
Estimated Value: $100,000 - $174,000
3
Beds
1
Bath
1,014
Sq Ft
$136/Sq Ft
Est. Value
About This Home
This home is located at 116 Elizabeth St, Cedartown, GA 30125 and is currently estimated at $138,157, approximately $136 per square foot. 116 Elizabeth St is a home located in Polk County with nearby schools including Cedar Christian School.
Ownership History
Date
Name
Owned For
Owner Type
Purchase Details
Closed on
Apr 1, 2015
Sold by
Vfc Properties 31 Llc
Bought by
J & A Rental Properties Llc
Current Estimated Value
Purchase Details
Closed on
Dec 19, 2014
Sold by
Smith Gary P
Bought by
Vfc Properties 31 Llc
Purchase Details
Closed on
Mar 7, 2014
Sold by
Smith Gary P *M and Smith P
Bought by
Vfc Properties 31 Llc
Purchase Details
Closed on
Apr 30, 2005
Sold by
Bright Michael A
Bought by
Smith Gary P
Purchase Details
Closed on
Jan 13, 1986
Sold by
Bright J Doyal
Bought by
Bright Michael A
Purchase Details
Closed on
Dec 28, 1984
Sold by
Watson Millie
Bought by
Bright J Doyal
Purchase Details
Closed on
Mar 12, 1971
Sold by
Mason G C
Bought by
Watson Millie
Purchase Details
Closed on
Aug 15, 1936
Bought by
Mason G C
Create a Home Valuation Report for This Property
The Home Valuation Report is an in-depth analysis detailing your home's value as well as a comparison with similar homes in the area
Home Values in the Area
Average Home Value in this Area
Purchase History
| Date | Buyer | Sale Price | Title Company |
|---|---|---|---|
| J & A Rental Properties Llc | $575,000 | -- | |
| Vfc Properties 31 Llc | -- | -- | |
| Vfc Properties 31 Llc | -- | -- | |
| Smith Gary P | $32,500 | -- | |
| Bright Michael A | -- | -- | |
| Bright J Doyal | -- | -- | |
| Watson Millie | -- | -- | |
| Mason G C | -- | -- |
Source: Public Records
Tax History Compared to Growth
Tax History
| Year | Tax Paid | Tax Assessment Tax Assessment Total Assessment is a certain percentage of the fair market value that is determined by local assessors to be the total taxable value of land and additions on the property. | Land | Improvement |
|---|---|---|---|---|
| 2024 | $1,273 | $40,306 | $2,200 | $38,106 |
| 2023 | $658 | $18,974 | $550 | $18,424 |
| 2022 | $380 | $15,995 | $550 | $15,445 |
| 2021 | $385 | $15,995 | $550 | $15,445 |
| 2020 | $385 | $15,995 | $550 | $15,445 |
| 2019 | $248 | $9,249 | $1,531 | $7,718 |
| 2018 | $241 | $8,762 | $1,312 | $7,450 |
| 2017 | $238 | $8,762 | $1,312 | $7,450 |
| 2016 | $130 | $8,762 | $1,312 | $7,450 |
| 2015 | $242 | $8,864 | $1,312 | $7,552 |
| 2014 | $244 | $8,864 | $1,312 | $7,552 |
| 2013 | -- | $8,777 | $1,225 | $7,552 |
Source: Public Records
Map
Nearby Homes
- 254 E Girard Ave
- 109 Perry St
- 1101 East Ave
- 537 Fletcher St
- 208 Highland Ave
- 328 330 Stubbs
- 427 Park St
- 144 Marshall St
- 328 Mountain Home Rd
- 601 Mountain Home Rd
- 228 Marshall St
- 217 E Gibson St
- 408 N College St
- 214 Victoria Ave
- 00 Juliette St
- 226 Central St
- 129 Thompson St
- 10 Woodglen Dr
- 607 N College St
- 421 Wissahickon Ave
- 118 Elizabeth St
- 110 Elizabeth St
- 120 Elizabeth St
- 121 Elizabeth St
- 111 Elizabeth St
- 115 Elizabeth St
- 113 Elizabeth St
- 109 Elizabeth St
- 122 Elizabeth St
- 105 Elizabeth St
- 127 Elizabeth St
- 124 Elizabeth St
- 715 East Ave
- 130 Elizabeth St
- 123 N Martiele St
- 130 N Broad St
- 128 N Broad St
- 134 N Broad St
- 119 N Martiele St
- 131 Elizabeth St