Estimated Value: $110,000 - $140,000
--
Bed
1
Bath
1,092
Sq Ft
$110/Sq Ft
Est. Value
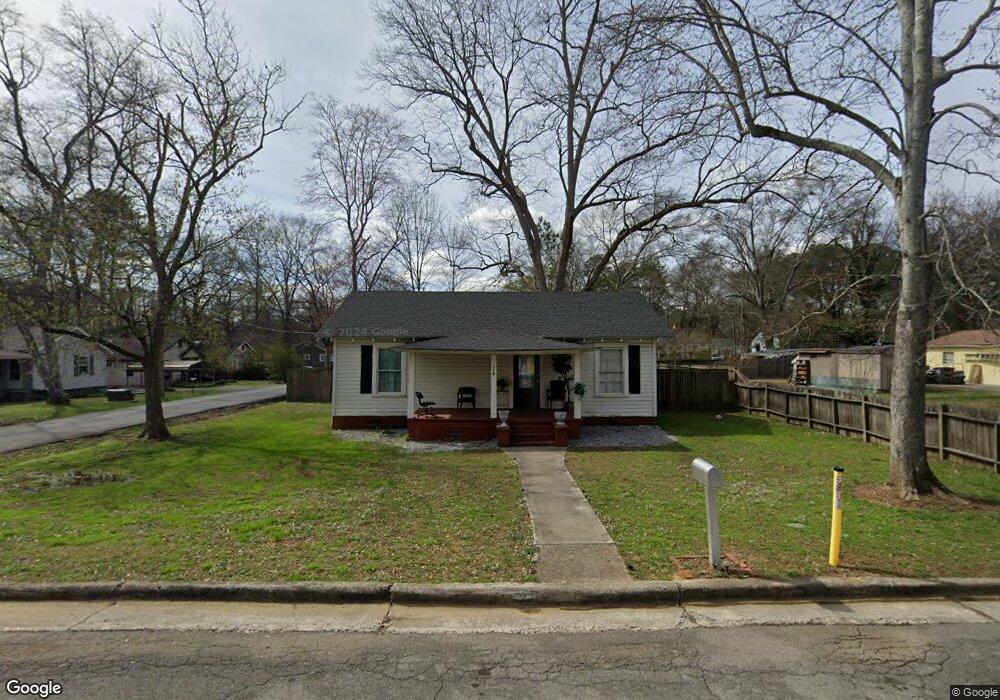
About This Home
This home is located at 116 Fay St SW, Rome, GA 30165 and is currently estimated at $119,840, approximately $109 per square foot. 116 Fay St SW is a home located in Floyd County with nearby schools including Rome High School and St. Mary School.
Ownership History
Date
Name
Owned For
Owner Type
Purchase Details
Closed on
Jun 16, 1994
Sold by
Davis Paul A and Davis Frances
Bought by
Mitchell Mitchell E and Mitchell Lynn T
Current Estimated Value
Purchase Details
Closed on
Oct 21, 1983
Sold by
Cross Louise Allen
Bought by
Davis Paul A and Davis Frances
Purchase Details
Closed on
Oct 10, 1983
Sold by
Lynch Linda Cross
Bought by
Cross Louise Allen
Purchase Details
Closed on
Mar 30, 1983
Sold by
Cross Louise Allen
Bought by
Lynch Linda Cross
Purchase Details
Closed on
Apr 16, 1980
Sold by
Hennon Mrs Esbin L
Bought by
Cross Louise Allen
Purchase Details
Closed on
May 5, 1979
Bought by
P and R
Purchase Details
Closed on
May 4, 1979
Bought by
P and R
Purchase Details
Closed on
May 3, 1979
Sold by
Payne Grover C and Payne Ruby
Bought by
Hennon Mrs Esbin L
Purchase Details
Closed on
Mar 26, 1975
Sold by
Davis Mrs Jane
Bought by
Payne Grover C and Payne Ruby
Purchase Details
Closed on
Jul 11, 1972
Sold by
Vaughn Mrs H N
Bought by
Davis Mrs Jane
Purchase Details
Closed on
Feb 1, 1972
Sold by
Vaughn H N
Bought by
Vaughn Mrs H N
Purchase Details
Closed on
Jan 30, 1943
Bought by
Vaughn H N
Create a Home Valuation Report for This Property
The Home Valuation Report is an in-depth analysis detailing your home's value as well as a comparison with similar homes in the area
Home Values in the Area
Average Home Value in this Area
Purchase History
| Date | Buyer | Sale Price | Title Company |
|---|---|---|---|
| Mitchell Mitchell E | $25,500 | -- | |
| Davis Paul A | $21,500 | -- | |
| Cross Louise Allen | $1,000 | -- | |
| Lynch Linda Cross | -- | -- | |
| Cross Louise Allen | -- | -- | |
| P | -- | -- | |
| P | -- | -- | |
| Hennon Mrs Esbin L | $16,000 | -- | |
| Payne Grover C | $13,600 | -- | |
| Davis Mrs Jane | -- | -- | |
| Vaughn Mrs H N | -- | -- | |
| Vaughn H N | -- | -- |
Source: Public Records
Tax History Compared to Growth
Tax History
| Year | Tax Paid | Tax Assessment Tax Assessment Total Assessment is a certain percentage of the fair market value that is determined by local assessors to be the total taxable value of land and additions on the property. | Land | Improvement |
|---|---|---|---|---|
| 2024 | $1,388 | $35,687 | $7,131 | $28,556 |
| 2023 | $1,264 | $33,668 | $6,339 | $27,329 |
| 2022 | $946 | $25,930 | $5,282 | $20,648 |
| 2021 | $878 | $23,672 | $5,282 | $18,390 |
| 2020 | $794 | $21,223 | $3,962 | $17,261 |
| 2019 | $745 | $20,116 | $3,962 | $16,154 |
| 2018 | $703 | $18,987 | $3,962 | $15,025 |
| 2017 | $678 | $18,314 | $3,962 | $14,352 |
| 2016 | $706 | $19,008 | $3,960 | $15,048 |
| 2015 | $667 | $19,008 | $3,960 | $15,048 |
| 2014 | $667 | $19,008 | $3,960 | $15,048 |
Source: Public Records
Map
Nearby Homes
- 50 Melton Ave SW
- 3 Pebble Bend Ct
- 8 Leon St SW
- 110 Williamson St SW
- 40 Paris Dr SW
- 8 S Hughes St SW
- 16 Wilkerson Rd SW
- 17 Wilkerson Rd SW
- 103 Wooten Dr SW
- 0 Mount Alto Rd SW Unit 10523740
- 100 Dellwood Dr NW
- 13 Ridgewood Rd SW
- 4 Homestead Cir NW
- 3 Walker Dr SW
- 438 Wilkerson Rd SW
- 14 Berckman Ln SW
- 3 Berckman Ln SW
- 23 Sweetspire Dr NW
- 21 Sweetspire Dr NW
- 112 Fay St SW
- 115 Leon St SW
- 1201 Magnolia Ave SW
- 1203 Magnolia Ave SW
- 113 Leon St SW
- 117 Fay St SW
- 1105 Magnolia Ave SW
- 1205 Magnolia Ave SW
- 113 Fay St SW
- 111 Leon St SW
- 1103 Magnolia Ave SW
- 110 Fay St SW
- 1207 Magnolia Ave SW
- 111 Fay St SW
- 1102 Magnolia Ave SW
- 109 Leon St SW
- 1110 Oakland Ave SW
- 1106 Oakland Ave SW
- 200 S Sycamore St SW
- 109 Fay St SW