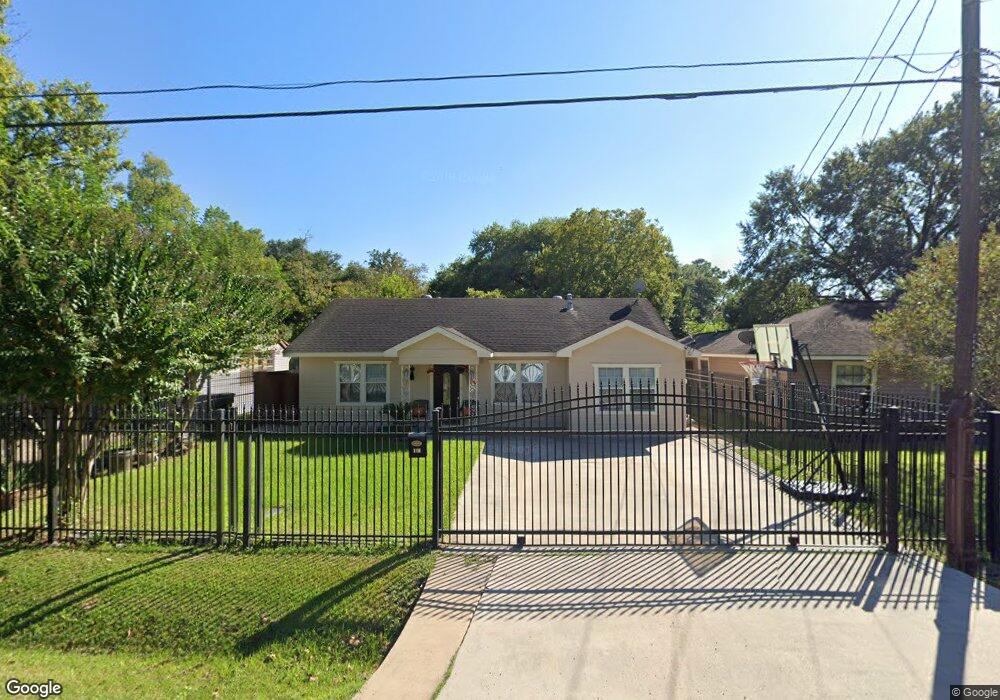
116 Fichter St Houston, TX 77022
Northside-Northline NeighborhoodEstimated Value: $191,000 - $254,000
3
Beds
1
Bath
1,203
Sq Ft
$175/Sq Ft
Est. Value
About This Home
This home is located at 116 Fichter St, Houston, TX 77022 and is currently estimated at $211,101, approximately $175 per square foot. 116 Fichter St is a home located in Harris County with nearby schools including Burbank Elementary School, Burbank Middle School, and Sam Houston Math, Science & Technology Center.
Ownership History
Date
Name
Owned For
Owner Type
Purchase Details
Closed on
Aug 5, 1999
Sold by
Rankin Glenda Maurice Shuffler and Artz Debbie Muril Shuffler
Bought by
Alanis Jose C
Current Estimated Value
Home Financials for this Owner
Home Financials are based on the most recent Mortgage that was taken out on this home.
Original Mortgage
$44,000
Outstanding Balance
$12,624
Interest Rate
7.63%
Mortgage Type
Stand Alone First
Estimated Equity
$198,477
Create a Home Valuation Report for This Property
The Home Valuation Report is an in-depth analysis detailing your home's value as well as a comparison with similar homes in the area
Home Values in the Area
Average Home Value in this Area
Purchase History
| Date | Buyer | Sale Price | Title Company |
|---|---|---|---|
| Alanis Jose C | -- | Regency Title |
Source: Public Records
Mortgage History
| Date | Status | Borrower | Loan Amount |
|---|---|---|---|
| Open | Alanis Jose C | $44,000 |
Source: Public Records
Tax History Compared to Growth
Tax History
| Year | Tax Paid | Tax Assessment Tax Assessment Total Assessment is a certain percentage of the fair market value that is determined by local assessors to be the total taxable value of land and additions on the property. | Land | Improvement |
|---|---|---|---|---|
| 2025 | $1,763 | $209,209 | $76,000 | $133,209 |
| 2024 | $1,763 | $195,216 | $69,750 | $125,466 |
| 2023 | $1,763 | $216,505 | $42,500 | $174,005 |
| 2022 | $2,856 | $177,645 | $42,500 | $135,145 |
| 2021 | $2,748 | $140,349 | $42,500 | $97,849 |
| 2020 | $2,596 | $128,977 | $42,500 | $86,477 |
| 2019 | $2,466 | $126,683 | $35,000 | $91,683 |
| 2018 | $1,501 | $100,488 | $29,250 | $71,238 |
| 2017 | $2,036 | $100,488 | $29,250 | $71,238 |
| 2016 | $1,851 | $90,060 | $27,500 | $62,560 |
| 2015 | $1,071 | $75,920 | $20,000 | $55,920 |
| 2014 | $1,071 | $75,920 | $20,000 | $55,920 |
Source: Public Records
Map
Nearby Homes
- 108 Fichter St
- 132 Grothe Ln
- 216 Burress St
- 249 De Boll St
- 253 De Boll St
- 90 Burress St Unit B
- 90 Burress St Unit A
- 61 Trenwood Ln
- 318 Charlock St
- 70 Burress St
- 411 Berry Rd
- 56 Wellford St
- 44 Farrell St
- 9026 Mcgallion Rd
- 45 Wellford St
- 88 Berry Rd
- 235 Julia St Unit B
- 202 Burbank St
- 240 Julia St Unit D
- 8205 Appleton St