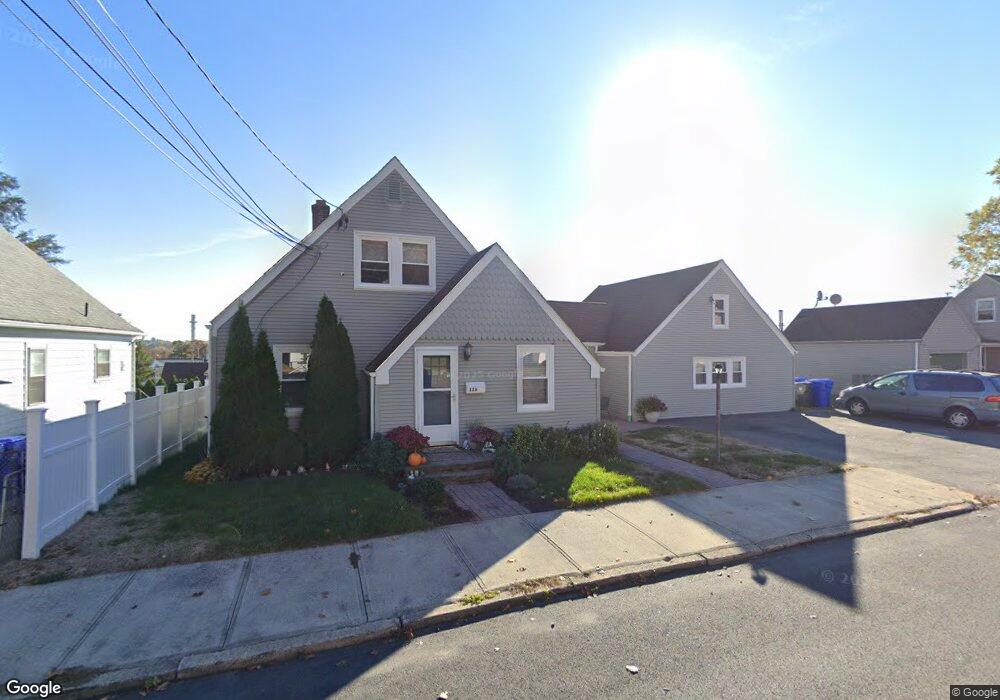
116 Fillmore St Pawtucket, RI 02860
Fairlawn NeighborhoodEstimated Value: $414,000 - $529,000
5
Beds
2
Baths
1,587
Sq Ft
$302/Sq Ft
Est. Value
About This Home
This home is located at 116 Fillmore St, Pawtucket, RI 02860 and is currently estimated at $479,541, approximately $302 per square foot. 116 Fillmore St is a home located in Providence County with nearby schools including The San Miguel School, Bishop Keough Regional High School, and Ocean Tides School.
Ownership History
Date
Name
Owned For
Owner Type
Purchase Details
Closed on
Dec 23, 2004
Sold by
Equivest Llc
Bought by
Flores Jose and Flores Maria
Current Estimated Value
Home Financials for this Owner
Home Financials are based on the most recent Mortgage that was taken out on this home.
Original Mortgage
$222,000
Outstanding Balance
$110,490
Interest Rate
5.74%
Mortgage Type
Purchase Money Mortgage
Estimated Equity
$369,051
Purchase Details
Closed on
Jun 9, 2004
Sold by
Mcdonald William
Bought by
Equivest Llc
Create a Home Valuation Report for This Property
The Home Valuation Report is an in-depth analysis detailing your home's value as well as a comparison with similar homes in the area
Home Values in the Area
Average Home Value in this Area
Purchase History
| Date | Buyer | Sale Price | Title Company |
|---|---|---|---|
| Flores Jose | $277,000 | -- | |
| Equivest Llc | $195,000 | -- |
Source: Public Records
Mortgage History
| Date | Status | Borrower | Loan Amount |
|---|---|---|---|
| Open | Equivest Llc | $222,000 |
Source: Public Records
Tax History
| Year | Tax Paid | Tax Assessment Tax Assessment Total Assessment is a certain percentage of the fair market value that is determined by local assessors to be the total taxable value of land and additions on the property. | Land | Improvement |
|---|---|---|---|---|
| 2025 | $5,482 | $416,900 | $132,400 | $284,500 |
| 2024 | $5,145 | $416,900 | $132,400 | $284,500 |
| 2023 | $4,565 | $269,500 | $68,000 | $201,500 |
| 2022 | $4,468 | $269,500 | $68,000 | $201,500 |
| 2021 | $4,468 | $269,500 | $68,000 | $201,500 |
| 2020 | $4,163 | $199,300 | $65,400 | $133,900 |
| 2019 | $4,163 | $199,300 | $65,400 | $133,900 |
| 2018 | $4,012 | $199,300 | $65,400 | $133,900 |
| 2017 | $3,617 | $159,200 | $49,900 | $109,300 |
| 2016 | $3,485 | $159,200 | $49,900 | $109,300 |
| 2015 | $3,485 | $159,200 | $49,900 | $109,300 |
| 2014 | $3,577 | $155,100 | $55,400 | $99,700 |
Source: Public Records
Map
Nearby Homes
- 112 Fillmore St
- 126 Fillmore St
- 105 Toledo Ave
- 133 Oneida St
- 125 Oneida St
- 104 Fillmore St
- 135 Oneida St
- 121 Oneida St
- 105 Fillmore St
- 119 Fillmore St
- 123 Fillmore St
- 117 Oneida St
- 113 Oneida St
- 100 Fillmore St
- 139 Toledo Ave
- 75 Toledo Ave
- 460 Buchanan St
- 464 Buchanan St
- 126 Toledo Ave
- 134 Oneida St
Your Personal Tour Guide
Ask me questions while you tour the home.