Estimated Value: $454,859 - $528,000
3
Beds
2
Baths
1,778
Sq Ft
$272/Sq Ft
Est. Value
About This Home
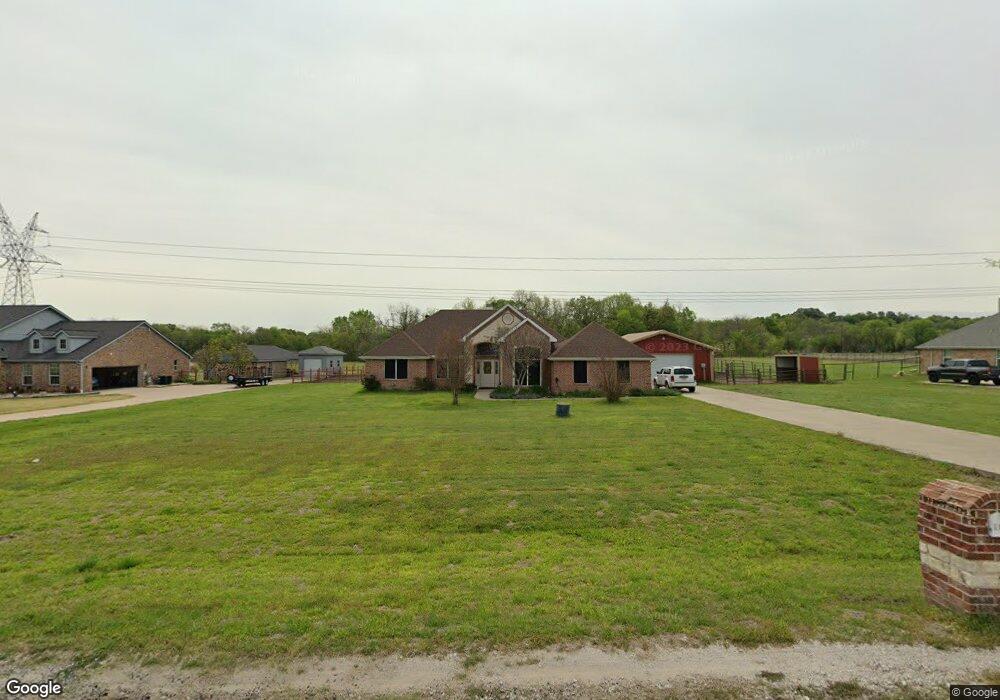
This home is located at 116 Fossil Rock Dr, Azle, TX 76020 and is currently estimated at $483,215, approximately $271 per square foot. 116 Fossil Rock Dr is a home located in Parker County with nearby schools including Silver Creek Elementary School, Azle Elementary School, and Azle Junior High School.
Ownership History
Date
Name
Owned For
Owner Type
Purchase Details
Closed on
Feb 17, 2009
Sold by
Sauls William and Sauls Julianna
Bought by
Morgan Sheryl F
Current Estimated Value
Home Financials for this Owner
Home Financials are based on the most recent Mortgage that was taken out on this home.
Original Mortgage
$138,800
Outstanding Balance
$86,461
Interest Rate
4.91%
Mortgage Type
Purchase Money Mortgage
Estimated Equity
$396,754
Purchase Details
Closed on
Jul 18, 2003
Sold by
Thurman Homes Inc
Bought by
Morgan Sheryl F
Purchase Details
Closed on
Jul 16, 2003
Sold by
Thurman Homes Inc
Bought by
Morgan Sheryl F
Purchase Details
Closed on
Mar 12, 2003
Sold by
Ellis Lewis W and Ellis Tommie
Bought by
Morgan Sheryl F
Create a Home Valuation Report for This Property
The Home Valuation Report is an in-depth analysis detailing your home's value as well as a comparison with similar homes in the area
Home Values in the Area
Average Home Value in this Area
Purchase History
| Date | Buyer | Sale Price | Title Company |
|---|---|---|---|
| Morgan Sheryl F | -- | -- | |
| Whiteman Sheryl F | -- | None Available | |
| Morgan Sheryl F | -- | -- | |
| Morgan Sheryl F | -- | -- | |
| Morgan Sheryl F | -- | -- |
Source: Public Records
Mortgage History
| Date | Status | Borrower | Loan Amount |
|---|---|---|---|
| Open | Whiteman Sheryl F | $138,800 |
Source: Public Records
Tax History Compared to Growth
Tax History
| Year | Tax Paid | Tax Assessment Tax Assessment Total Assessment is a certain percentage of the fair market value that is determined by local assessors to be the total taxable value of land and additions on the property. | Land | Improvement |
|---|---|---|---|---|
| 2025 | $1,947 | $360,411 | -- | -- |
| 2024 | $1,947 | $327,646 | -- | -- |
| 2023 | $1,947 | $297,860 | $0 | $0 |
| 2022 | $5,011 | $306,880 | $73,800 | $233,080 |
| 2021 | $4,773 | $306,880 | $73,800 | $233,080 |
| 2020 | $4,315 | $240,040 | $61,020 | $179,020 |
| 2019 | $4,158 | $240,040 | $61,020 | $179,020 |
| 2018 | $3,792 | $184,950 | $35,000 | $149,950 |
| 2017 | $3,613 | $184,950 | $35,000 | $149,950 |
| 2016 | $3,375 | $172,730 | $35,000 | $137,730 |
| 2015 | $1,243 | $172,730 | $35,000 | $137,730 |
| 2014 | $3,136 | $170,390 | $35,000 | $135,390 |
Source: Public Records
Map
Nearby Homes
- 101 Creekpath Dr
- 177 Lost Oak Dr
- 189 Stoney Ridge
- 412 Skyview Ln
- 200 W Bozeman Ln
- 101 E Bozeman Ln
- 704 Glade Park Ct
- 145 Clayton Rd
- 175 N Boyce Ln
- 105 Beaver Creek Dr
- 2014 Spring Ct Unit 2
- 2014 Spring Ct
- 141 E Bozeman Ln
- 2013 Spring Ct
- 2010 Spring Ct
- 2010 Spring Ct Unit A
- 138 Bluff Creek Rd
- 900 Reese Ln
- 9121 S Fm 730
- 417 Collum View
- 124 Fossil Rock Dr
- 108 Fossil Rock Dr
- 111 Fossil Rock Dr
- 123 Fossil Rock Dr
- 132 Fossil Rock Dr
- 100 Fossil Rock Dr
- 131 Fossil Rock Dr
- 140 Fossil Rock Dr
- 101 Fossil Rock Dr
- 105 Lost Oak Dr
- 148 Fossil Rock Dr
- 143 Fossil Rock Dr
- 111 Lost Oak Dr
- 155 Fossil Rock Dr
- 156 Fossil Rock Dr
- 134 Lost Oak Dr
- 164 Fossil Rock Dr
- 123 Lost Oak Dr
- 129 Lost Oak Dr
- 163 Fossil Rock Dr