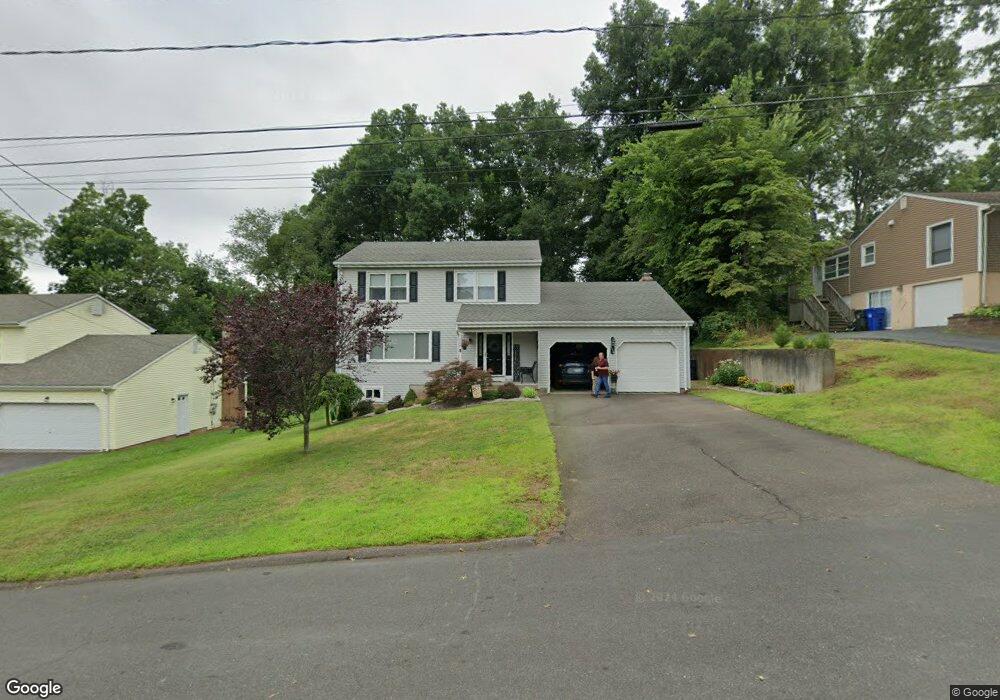
116 Foster St Newington, CT 06111
Estimated Value: $463,880 - $528,000
3
Beds
3
Baths
1,800
Sq Ft
$273/Sq Ft
Est. Value
About This Home
This home is located at 116 Foster St, Newington, CT 06111 and is currently estimated at $491,470, approximately $273 per square foot. 116 Foster St is a home located in Hartford County with nearby schools including John Paterson School, John Wallace Middle School, and Newington High School.
Ownership History
Date
Name
Owned For
Owner Type
Purchase Details
Closed on
May 18, 2019
Sold by
Chiulli Fabrizio
Bought by
Chiulli Antonino S
Current Estimated Value
Purchase Details
Closed on
Jun 29, 2009
Sold by
Borselle Dennis R and Demko Michelle
Bought by
Rutkowski Paul M and Rutkowski Terry A
Home Financials for this Owner
Home Financials are based on the most recent Mortgage that was taken out on this home.
Original Mortgage
$240,000
Interest Rate
4.92%
Purchase Details
Closed on
Jul 30, 2004
Sold by
Mcintosh Janet and Mcintosh Jeff
Bought by
Borselle Dennis R and Demko Michelle
Purchase Details
Closed on
Aug 5, 1987
Sold by
Makoski Frank
Bought by
Forrest Michael R
Create a Home Valuation Report for This Property
The Home Valuation Report is an in-depth analysis detailing your home's value as well as a comparison with similar homes in the area
Home Values in the Area
Average Home Value in this Area
Purchase History
| Date | Buyer | Sale Price | Title Company |
|---|---|---|---|
| Chiulli Antonino S | -- | -- | |
| Rutkowski Paul M | $300,000 | -- | |
| Borselle Dennis R | $270,000 | -- | |
| Forrest Michael R | $188,500 | -- |
Source: Public Records
Mortgage History
| Date | Status | Borrower | Loan Amount |
|---|---|---|---|
| Previous Owner | Forrest Michael R | $240,000 | |
| Previous Owner | Forrest Michael R | $30,000 |
Source: Public Records
Tax History Compared to Growth
Tax History
| Year | Tax Paid | Tax Assessment Tax Assessment Total Assessment is a certain percentage of the fair market value that is determined by local assessors to be the total taxable value of land and additions on the property. | Land | Improvement |
|---|---|---|---|---|
| 2025 | $7,659 | $191,560 | $55,680 | $135,880 |
| 2024 | $7,599 | $191,560 | $55,680 | $135,880 |
| 2023 | $7,348 | $191,560 | $55,680 | $135,880 |
| 2022 | $7,373 | $191,560 | $55,680 | $135,880 |
| 2021 | $7,434 | $191,560 | $55,680 | $135,880 |
| 2020 | $7,844 | $199,690 | $55,680 | $144,010 |
| 2019 | $7,878 | $199,690 | $55,680 | $144,010 |
| 2018 | $7,688 | $199,690 | $55,680 | $144,010 |
| 2017 | $7,307 | $199,690 | $55,680 | $144,010 |
| 2016 | $7,139 | $199,690 | $55,680 | $144,010 |
| 2014 | $6,746 | $194,010 | $55,570 | $138,440 |
Source: Public Records
Map
Nearby Homes