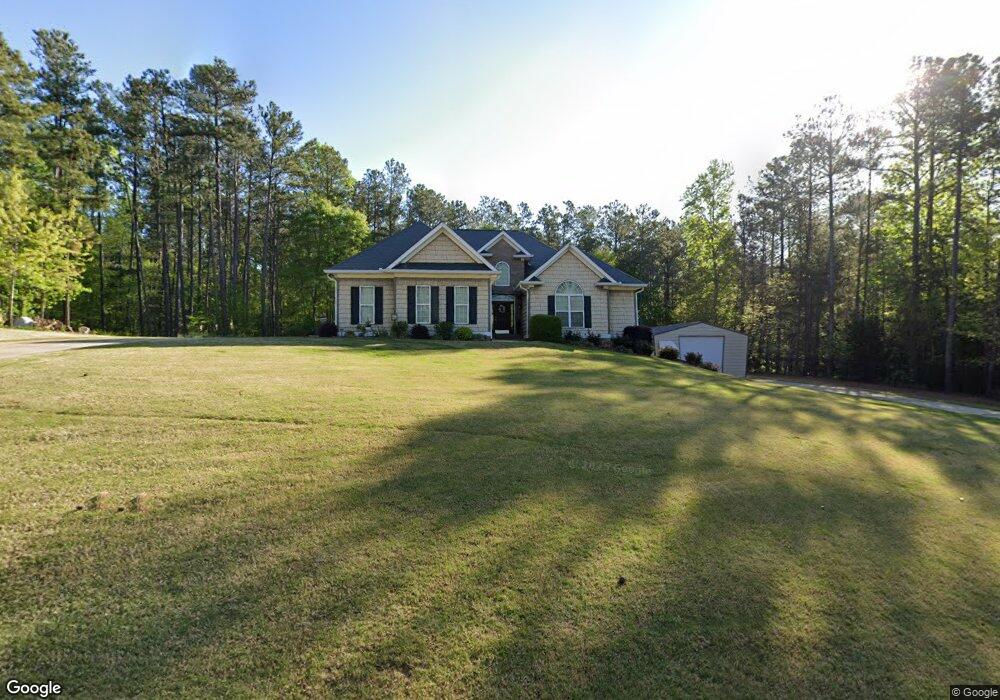
116 Garnett Point Dr Unit 39 Carrollton, GA 30117
Abilene NeighborhoodEstimated Value: $521,669 - $696,000
3
Beds
3
Baths
2,035
Sq Ft
$284/Sq Ft
Est. Value
About This Home
This home is located at 116 Garnett Point Dr Unit 39, Carrollton, GA 30117 and is currently estimated at $578,417, approximately $284 per square foot. 116 Garnett Point Dr Unit 39 is a home located in Carroll County with nearby schools including Mt. Zion Elementary School, Mt. Zion Middle School, and Mt. Zion High School.
Ownership History
Date
Name
Owned For
Owner Type
Purchase Details
Closed on
Jul 7, 2017
Sold by
Ridley Hope D
Bought by
Powers Bradley H and Powers Sharron L
Current Estimated Value
Purchase Details
Closed on
Oct 17, 2007
Sold by
Cornerstone Construction O
Bought by
Ridley Hope D
Home Financials for this Owner
Home Financials are based on the most recent Mortgage that was taken out on this home.
Original Mortgage
$214,240
Interest Rate
6.27%
Mortgage Type
New Conventional
Purchase Details
Closed on
Aug 23, 2005
Sold by
Mcdowell Dennis H
Bought by
Cornerstone Construction Of We
Home Financials for this Owner
Home Financials are based on the most recent Mortgage that was taken out on this home.
Original Mortgage
$222,257
Interest Rate
5.71%
Mortgage Type
New Conventional
Purchase Details
Closed on
Apr 25, 2005
Bought by
Mcdowell Dennis H
Create a Home Valuation Report for This Property
The Home Valuation Report is an in-depth analysis detailing your home's value as well as a comparison with similar homes in the area
Home Values in the Area
Average Home Value in this Area
Purchase History
| Date | Buyer | Sale Price | Title Company |
|---|---|---|---|
| Powers Bradley H | $325,000 | -- | |
| Ridley Hope D | $267,800 | -- | |
| Cornerstone Construction Of We | $60,000 | -- | |
| Mcdowell Dennis H | -- | -- |
Source: Public Records
Mortgage History
| Date | Status | Borrower | Loan Amount |
|---|---|---|---|
| Previous Owner | Ridley Hope D | $214,240 | |
| Previous Owner | Cornerstone Construction Of We | $222,257 |
Source: Public Records
Tax History Compared to Growth
Tax History
| Year | Tax Paid | Tax Assessment Tax Assessment Total Assessment is a certain percentage of the fair market value that is determined by local assessors to be the total taxable value of land and additions on the property. | Land | Improvement |
|---|---|---|---|---|
| 2024 | $640 | $225,362 | $12,800 | $212,562 |
| 2023 | $640 | $206,590 | $12,800 | $193,790 |
| 2022 | $762 | $168,505 | $12,800 | $155,705 |
| 2021 | $768 | $146,845 | $12,800 | $134,045 |
| 2020 | $771 | $130,290 | $12,800 | $117,490 |
| 2019 | $792 | $120,230 | $12,800 | $107,430 |
| 2018 | $830 | $114,441 | $12,800 | $101,641 |
| 2017 | $2,604 | $109,317 | $12,800 | $96,517 |
| 2016 | $2,605 | $109,317 | $12,800 | $96,517 |
| 2015 | $2,043 | $77,067 | $14,442 | $62,626 |
| 2014 | $2,052 | $77,068 | $14,442 | $62,626 |
Source: Public Records
Map
Nearby Homes
- 1800 Mandeville Rd
- 177 Garnett Point Dr
- 0000 Hog Liver Rd
- Plan 1709 at Saddle Ridge
- Plan 3119 at Saddle Ridge
- Plan 1902 at Saddle Ridge
- Plan 2131 at Saddle Ridge
- Plan 2307 at Saddle Ridge
- Plan 2604 at Saddle Ridge
- 2519 Hog Liver Rd
- 539 Saddle Chase Dr
- 549 McGukin Rd
- 446 McGukin Rd
- 14 Cole Lake Rd
- 00 Hog Liver Rd Unit 346
- 0 Hog Liver Rd Unit 148331
- 0 Hog Liver Rd Unit 10630257
- 0 Hog Liver Rd Unit 7671087
- 0 Hog Liver Rd Unit 10614601
- 0 Hog Liver Rd Unit 10630818
- 116 Garnett Point Dr
- 112 Garnett Point Dr
- 120 Garnett Point Dr Unit 38
- 120 Garnett Point Dr
- 108 Garnett Point Dr
- 113 Garnett Point Dr
- 124 Garnet Point Dr
- 105 Garnett Point Dr
- 104 Garnett Point Dr
- 200 Cranston Ct
- 213 Cranston Ct
- 132 Garnett Point Dr
- 209 Cranston Ct
- 121 Garnett Point Dr
- 136 Garnett Point Dr
- 101 Garnett Point Dr
- 125 Garnett Point Dr
- 133 Garnett Point Dr
- 100 Garnett Point Dr
- 1486 Mandeville Rd