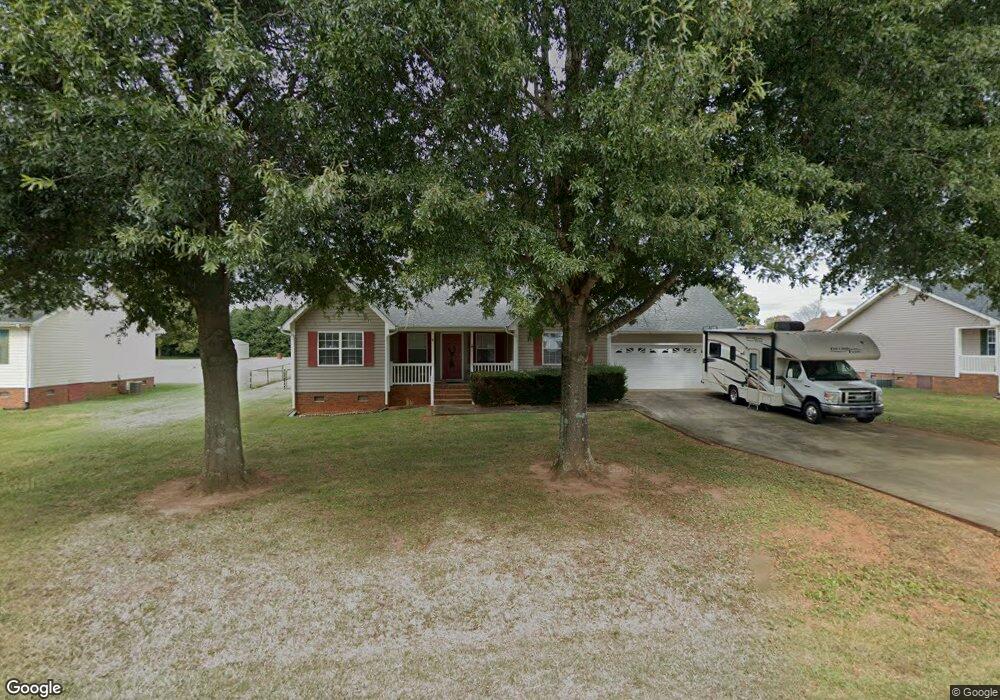
116 Grainger Ln Statesville, NC 28625
Estimated Value: $303,000 - $364,094
3
Beds
2
Baths
2,174
Sq Ft
$151/Sq Ft
Est. Value
About This Home
This home is located at 116 Grainger Ln, Statesville, NC 28625 and is currently estimated at $328,274, approximately $151 per square foot. 116 Grainger Ln is a home located in Iredell County with nearby schools including Scotts Elementary School, West Iredell Middle School, and West Iredell High School.
Ownership History
Date
Name
Owned For
Owner Type
Purchase Details
Closed on
Mar 27, 2011
Sold by
Lambert John Wayne
Bought by
Lambert Wanda G
Current Estimated Value
Purchase Details
Closed on
Mar 29, 2000
Sold by
Bandy William D and Kay Gina
Bought by
Lambert John Wayne and Lambert Wanda Gosnell
Home Financials for this Owner
Home Financials are based on the most recent Mortgage that was taken out on this home.
Original Mortgage
$86,900
Interest Rate
8.29%
Purchase Details
Closed on
May 21, 1998
Sold by
Crandall & Obrien Construction Company
Bought by
Bandy William Douglas and Bandy Gina Kay
Home Financials for this Owner
Home Financials are based on the most recent Mortgage that was taken out on this home.
Original Mortgage
$106,300
Interest Rate
7.11%
Purchase Details
Closed on
Apr 1, 1997
Create a Home Valuation Report for This Property
The Home Valuation Report is an in-depth analysis detailing your home's value as well as a comparison with similar homes in the area
Home Values in the Area
Average Home Value in this Area
Purchase History
| Date | Buyer | Sale Price | Title Company |
|---|---|---|---|
| Lambert Wanda G | -- | -- | |
| Lambert John Wayne | $108,900 | -- | |
| Bandy William Douglas | $113,000 | -- | |
| -- | -- | -- |
Source: Public Records
Mortgage History
| Date | Status | Borrower | Loan Amount |
|---|---|---|---|
| Previous Owner | Lambert John Wayne | $86,900 | |
| Previous Owner | Bandy William Douglas | $106,300 |
Source: Public Records
Tax History Compared to Growth
Tax History
| Year | Tax Paid | Tax Assessment Tax Assessment Total Assessment is a certain percentage of the fair market value that is determined by local assessors to be the total taxable value of land and additions on the property. | Land | Improvement |
|---|---|---|---|---|
| 2024 | $1,434 | $232,950 | $30,000 | $202,950 |
| 2023 | $1,434 | $232,950 | $30,000 | $202,950 |
| 2022 | $1,000 | $149,860 | $18,000 | $131,860 |
| 2021 | $996 | $149,860 | $18,000 | $131,860 |
| 2020 | $996 | $149,860 | $18,000 | $131,860 |
| 2019 | $981 | $149,860 | $18,000 | $131,860 |
| 2018 | $843 | $132,420 | $10,500 | $121,920 |
| 2017 | $843 | $132,420 | $10,500 | $121,920 |
| 2016 | $843 | $132,420 | $10,500 | $121,920 |
| 2015 | $843 | $132,420 | $10,500 | $121,920 |
| 2014 | $788 | $132,590 | $10,500 | $122,090 |
Source: Public Records
Map
Nearby Homes
- 117 Grainger Ln
- 648 Scotts Creek Rd
- 113 E Edinburgh Ct
- 599 Scotts Creek Rd
- 0 Cedarbrook Dr Unit 45
- 114 Cedar Ridge Loop
- 3925 Taylorsville Hwy
- 126 Penguin Ln
- 124 Smokestack Ln
- 212 Doe Trail Ln
- 154 Emma Ln
- 119 Watts Ct
- 115 Morrison Creek Rd
- 124 Caribou Dr
- 108 Red Cedar Ln
- 114 Red Cedar Ln
- 146 Beech Brook Ln
- 120 Rosy Apple Ln Unit 124
- 150 Forest Creek Dr
- 198 Castle Pines Ln
- 112 Grainger Ln
- 120 Grainger Ln
- 108 Grainger Ln
- 124 Grainger Ln
- 113 Grainger Ln
- 121 Grainger Ln
- 427 Little Farm Rd
- 128 Grainger Ln
- 104 Grainger Ln
- 109 Grainger Ln
- 125 Grainger Ln
- 129 Grainger Ln
- 105 Grainger Ln
- 116 Hayworth Ln
- 120 Hayworth Ln
- 108 Hayworth Ln
- 124 Hayworth Ln
- 779 Scotts Creek Rd
- 104 Hayworth Ln
- 128 Hayworth Ln