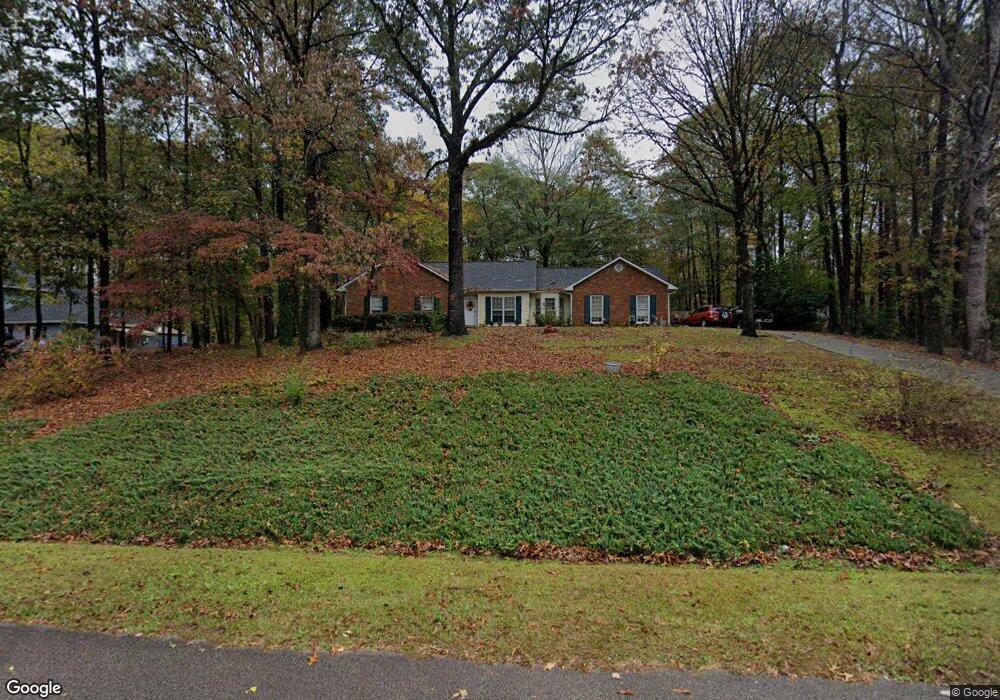
116 Greenbriar Trail Unit 64 Lagrange, GA 30241
Estimated Value: $246,000 - $272,000
3
Beds
2
Baths
1,572
Sq Ft
$164/Sq Ft
Est. Value
About This Home
This home is located at 116 Greenbriar Trail Unit 64, Lagrange, GA 30241 and is currently estimated at $257,438, approximately $163 per square foot. 116 Greenbriar Trail Unit 64 is a home located in Troup County with nearby schools including Callaway Elementary School, Hogansville Elementary School, and Callaway Middle School.
Ownership History
Date
Name
Owned For
Owner Type
Purchase Details
Closed on
Oct 31, 2016
Sold by
Duraski Rod M
Bought by
Johnson Christopher H and Johnson Joy L
Current Estimated Value
Home Financials for this Owner
Home Financials are based on the most recent Mortgage that was taken out on this home.
Original Mortgage
$106,960
Outstanding Balance
$49,295
Interest Rate
2.72%
Mortgage Type
New Conventional
Estimated Equity
$208,143
Purchase Details
Closed on
Jul 26, 2002
Sold by
Cusick Charles H and Cusick Mary A
Bought by
Beach Lois A
Purchase Details
Closed on
Feb 16, 2001
Sold by
Michael Michael R and Michael Belinda
Bought by
Cusick Charles H and Cusick Mary A
Purchase Details
Closed on
Feb 29, 2000
Sold by
Thompson Larry W and Thompson Susan W
Bought by
Michael Michael R and Michael Belinda
Purchase Details
Closed on
Dec 30, 1994
Sold by
Bryan Miller
Bought by
Thompson Larry W and Thompson Susan W
Purchase Details
Closed on
Sep 21, 1989
Bought by
Bryan Miller
Purchase Details
Closed on
Feb 1, 1987
Create a Home Valuation Report for This Property
The Home Valuation Report is an in-depth analysis detailing your home's value as well as a comparison with similar homes in the area
Home Values in the Area
Average Home Value in this Area
Purchase History
| Date | Buyer | Sale Price | Title Company |
|---|---|---|---|
| Johnson Christopher H | $133,700 | -- | |
| Beach Lois A | $127,000 | -- | |
| Cusick Charles H | $117,000 | -- | |
| Michael Michael R | $112,000 | -- | |
| Thompson Larry W | $86,000 | -- | |
| Bryan Miller | $82,800 | -- | |
| -- | -- | -- |
Source: Public Records
Mortgage History
| Date | Status | Borrower | Loan Amount |
|---|---|---|---|
| Open | Johnson Christopher H | $106,960 |
Source: Public Records
Tax History Compared to Growth
Tax History
| Year | Tax Paid | Tax Assessment Tax Assessment Total Assessment is a certain percentage of the fair market value that is determined by local assessors to be the total taxable value of land and additions on the property. | Land | Improvement |
|---|---|---|---|---|
| 2024 | $1,891 | $79,280 | $14,000 | $65,280 |
| 2023 | $1,929 | $80,680 | $14,000 | $66,680 |
| 2022 | $1,596 | $67,120 | $10,000 | $57,120 |
| 2021 | $1,566 | $61,880 | $10,000 | $51,880 |
| 2020 | $1,566 | $61,880 | $10,000 | $51,880 |
| 2019 | $1,282 | $52,440 | $6,000 | $46,440 |
| 2018 | $1,212 | $50,120 | $6,000 | $44,120 |
| 2017 | $1,212 | $50,120 | $6,000 | $44,120 |
| 2016 | $1,455 | $48,234 | $6,000 | $42,234 |
| 2015 | $1,590 | $52,644 | $3,600 | $49,044 |
| 2014 | $1,593 | $52,644 | $3,600 | $49,044 |
| 2013 | -- | $52,644 | $3,600 | $49,044 |
Source: Public Records
Map
Nearby Homes
- 2477 Upper Big Springs Rd
- 356 John Lovelace Rd
- 810 Callaway Church Rd
- 737 John Lovelace Rd
- 91 Almond Rd
- 403 Lexington Park Dr
- 1708 Upper Big Springs Rd Unit 18.93+/- AC
- 109 Lexington Park Dr
- 111 Revere Ct
- 401 Nashua Dr
- 313 Mourning Ct Unit LOT 32
- 311 Mourning Ct Unit LOT 33
- 401 Lower Big Springs Rd Unit LOT 1
- 670 Lower Big Springs Rd
- 783 Rosemont Rd
- 107 Beaver Creek Way
- 107 Beaver Creek Way Unit 249
- 105 Beaver Creek Way Unit 248
- 105 Beaver Creek Way
- 103 Beaver Creek Way
- 116 Greenbriar Trail
- 114 Greenbriar Trail
- 100 Briar Ct
- 102 Briar Ct
- 129 Greenbriar Trail
- 127 Greenbriar Trail
- 112 Greenbriar Trail
- 104 Briar Ct
- 125 Greenbriar Trail
- 131 Greenbriar Trail
- 120 Greenbriar Trail
- 108 Greenbriar Trail
- 123 Greenbriar Trail
- 110 Greenbriar Trail
- 106 Briar Ct Unit 60
- 106 Briar Ct
- 108 Briar Ct
- 106 Greenbriar Trail
- 133 Greenbriar Trail
- 121 Greenbriar Trail