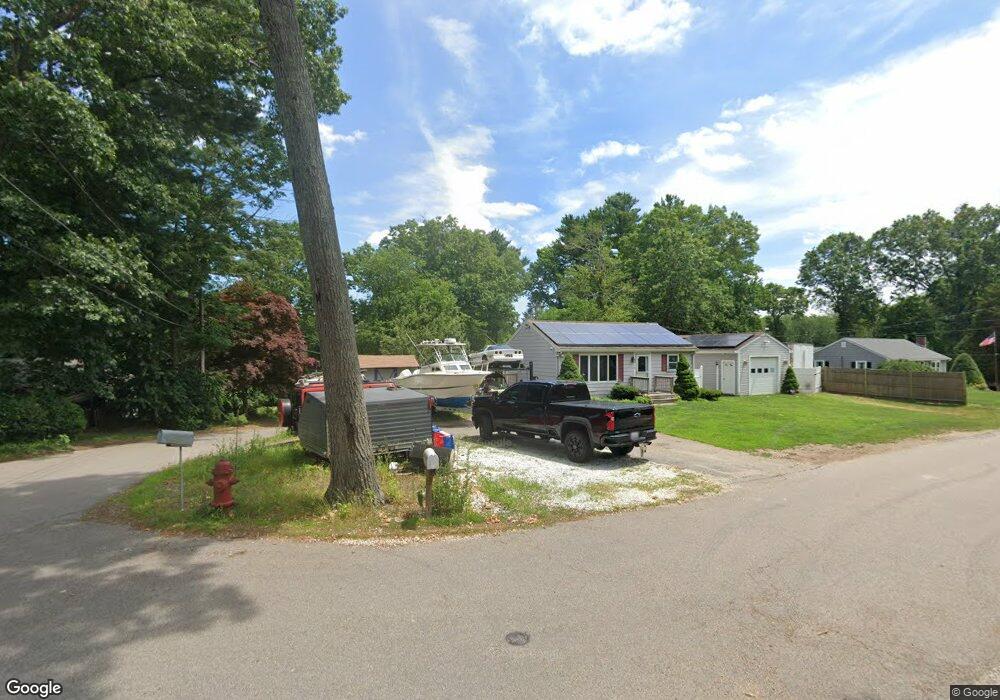
116 Hillcrest Rd East Bridgewater, MA 02333
Estimated Value: $420,000 - $490,000
2
Beds
2
Baths
720
Sq Ft
$628/Sq Ft
Est. Value
About This Home
This home is located at 116 Hillcrest Rd, East Bridgewater, MA 02333 and is currently estimated at $452,013, approximately $627 per square foot. 116 Hillcrest Rd is a home located in Plymouth County with nearby schools including Central Elementary School, Gordon W Mitchell Middle School, and East Bridgewater Jr./Sr. High School.
Ownership History
Date
Name
Owned For
Owner Type
Purchase Details
Closed on
Jul 26, 2019
Sold by
Cooke Robert J and Cooke Audrey R
Bought by
Cooke Robert J
Current Estimated Value
Home Financials for this Owner
Home Financials are based on the most recent Mortgage that was taken out on this home.
Original Mortgage
$198,000
Outstanding Balance
$173,518
Interest Rate
3.73%
Mortgage Type
New Conventional
Estimated Equity
$278,495
Purchase Details
Closed on
Jul 30, 2013
Sold by
Cooke Robert J
Bought by
Cooke Robert J and Cooke Audrey R
Purchase Details
Closed on
Aug 2, 1993
Sold by
116 Hillcrest Rd Nt
Bought by
Cooke Robert J and Cooke Donna M
Create a Home Valuation Report for This Property
The Home Valuation Report is an in-depth analysis detailing your home's value as well as a comparison with similar homes in the area
Home Values in the Area
Average Home Value in this Area
Purchase History
| Date | Buyer | Sale Price | Title Company |
|---|---|---|---|
| Cooke Robert J | -- | -- | |
| Cooke Robert J | -- | -- | |
| Cooke Robert J | $87,000 | -- |
Source: Public Records
Mortgage History
| Date | Status | Borrower | Loan Amount |
|---|---|---|---|
| Open | Cooke Robert J | $198,000 | |
| Previous Owner | Cooke Robert J | $40,000 | |
| Previous Owner | Cooke Robert J | $100,415 | |
| Previous Owner | Cooke Robert J | $30,000 |
Source: Public Records
Tax History Compared to Growth
Tax History
| Year | Tax Paid | Tax Assessment Tax Assessment Total Assessment is a certain percentage of the fair market value that is determined by local assessors to be the total taxable value of land and additions on the property. | Land | Improvement |
|---|---|---|---|---|
| 2025 | $5,210 | $381,100 | $164,900 | $216,200 |
| 2024 | $4,962 | $358,500 | $150,600 | $207,900 |
| 2023 | $4,935 | $341,500 | $150,600 | $190,900 |
| 2022 | $4,889 | $313,400 | $137,000 | $176,400 |
| 2021 | $4,757 | $279,000 | $131,600 | $147,400 |
| 2020 | $4,648 | $268,800 | $126,600 | $142,200 |
| 2019 | $4,545 | $258,800 | $121,000 | $137,800 |
| 2018 | $4,240 | $236,100 | $121,000 | $115,100 |
| 2017 | $4,119 | $225,100 | $115,400 | $109,700 |
| 2016 | $4,015 | $221,100 | $115,400 | $105,700 |
| 2015 | $3,769 | $212,200 | $108,500 | $103,700 |
| 2014 | $3,625 | $208,700 | $106,300 | $102,400 |
Source: Public Records
Map
Nearby Homes