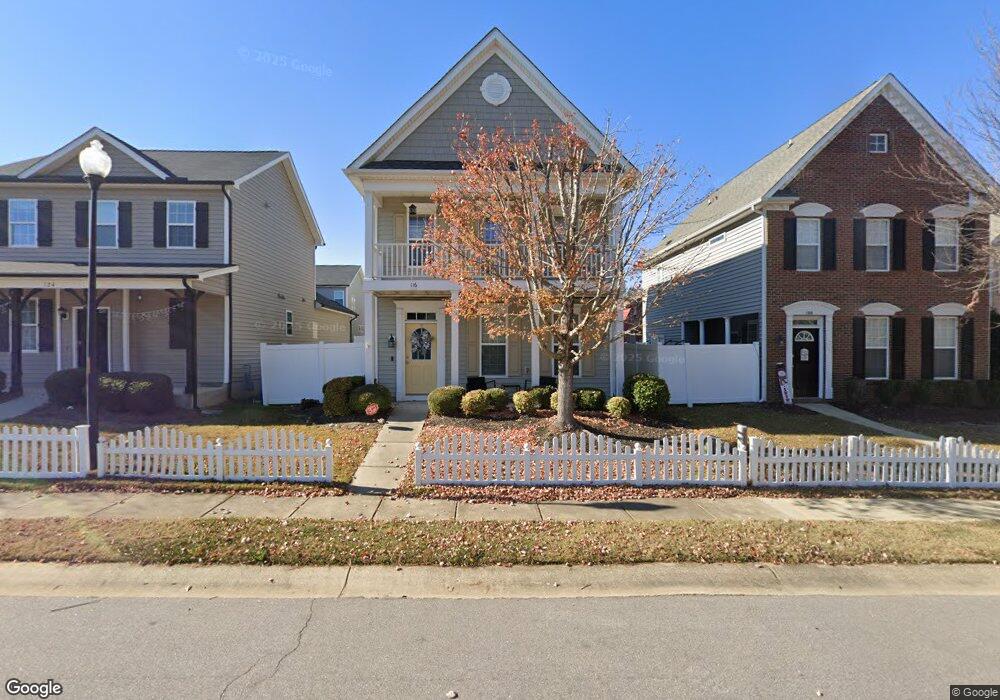
116 Honeybee Trace Clayton, NC 27520
Estimated Value: $278,000 - $298,000
3
Beds
3
Baths
1,504
Sq Ft
$193/Sq Ft
Est. Value
About This Home
This home is located at 116 Honeybee Trace, Clayton, NC 27520 and is currently estimated at $290,338, approximately $193 per square foot. 116 Honeybee Trace is a home located in Johnston County with nearby schools including West Clayton Elementary School, Clayton Middle School, and Clayton High.
Ownership History
Date
Name
Owned For
Owner Type
Purchase Details
Closed on
Jul 24, 2020
Sold by
Littleton Susan Blowers
Bought by
Lopez Jessenla
Current Estimated Value
Home Financials for this Owner
Home Financials are based on the most recent Mortgage that was taken out on this home.
Original Mortgage
$198,778
Outstanding Balance
$176,263
Interest Rate
3.1%
Mortgage Type
FHA
Estimated Equity
$114,075
Purchase Details
Closed on
Aug 25, 2016
Sold by
Greshamp James L and Gresham Julia
Bought by
Blowers Littleton Susan
Home Financials for this Owner
Home Financials are based on the most recent Mortgage that was taken out on this home.
Original Mortgage
$134,310
Interest Rate
3.42%
Mortgage Type
FHA
Purchase Details
Closed on
Jun 13, 2011
Sold by
Shields Construction Llc
Bought by
Gresham Ii James L
Home Financials for this Owner
Home Financials are based on the most recent Mortgage that was taken out on this home.
Original Mortgage
$159,400
Interest Rate
4.65%
Mortgage Type
New Conventional
Purchase Details
Closed on
Mar 28, 2002
Sold by
Lionsgate Village Llc
Bought by
Bullard Donald E
Create a Home Valuation Report for This Property
The Home Valuation Report is an in-depth analysis detailing your home's value as well as a comparison with similar homes in the area
Home Values in the Area
Average Home Value in this Area
Purchase History
| Date | Buyer | Sale Price | Title Company |
|---|---|---|---|
| Lopez Jessenla | $203,500 | None Available | |
| Blowers Littleton Susan | $165,000 | None Available | |
| Gresham Ii James L | $159,000 | None Available | |
| Bullard Donald E | -- | -- |
Source: Public Records
Mortgage History
| Date | Status | Borrower | Loan Amount |
|---|---|---|---|
| Open | Lopez Jessenla | $198,778 | |
| Previous Owner | Blowers Littleton Susan | $134,310 | |
| Previous Owner | Gresham Ii James L | $159,400 |
Source: Public Records
Tax History Compared to Growth
Tax History
| Year | Tax Paid | Tax Assessment Tax Assessment Total Assessment is a certain percentage of the fair market value that is determined by local assessors to be the total taxable value of land and additions on the property. | Land | Improvement |
|---|---|---|---|---|
| 2025 | $2,928 | $289,900 | $80,000 | $209,900 |
| 2024 | $2,380 | $180,280 | $50,000 | $130,280 |
| 2023 | $2,326 | $180,280 | $50,000 | $130,280 |
| 2022 | $2,398 | $180,280 | $50,000 | $130,280 |
| 2021 | $2,362 | $180,280 | $50,000 | $130,280 |
| 2020 | $2,344 | $174,900 | $50,000 | $124,900 |
| 2019 | $2,344 | $174,900 | $50,000 | $124,900 |
| 2018 | $2,073 | $152,460 | $42,000 | $110,460 |
| 2017 | $2,028 | $152,460 | $42,000 | $110,460 |
| 2016 | $2,028 | $152,460 | $42,000 | $110,460 |
| 2015 | $1,990 | $152,460 | $42,000 | $110,460 |
| 2014 | $1,990 | $152,460 | $42,000 | $110,460 |
Source: Public Records
Map
Nearby Homes
- 168 Honeybee Trace
- 70 Plott Hound Dr
- 403 Garrison Ave
- 113 Sturbridge Dr Unit 113
- 1509 Kenmore Dr
- 342 Durwin Ln
- 207 Sleepy Creek Dr
- 141 & 145 State Ave
- 479 Winding Wood Dr
- 541 Pinecroft Dr
- 200 Waterford Dr
- 1914 Parkside Village Dr
- 242 Liam St
- 1015 Mulberry Rd
- 700 Fernwood Dr
- 48 Enterprise Dr
- 212 Wexford Dr
- 215 W Moss Creek Dr
- 128 Glengariff Ln
- 316 Waterford Dr
- 124 Honeybee Trace
- 108 Honeybee Trace
- 132 Honeybee Trace
- 100 Honeybee Trace
- 51 Scotch Bonnet Ridge
- 43 Scotch Bonnet Ridge
- 63 Scotch Bonnet Ridge
- 33 Scotch Bonnet Ridge
- 142 Honeybee Trace
- 69 Scotch Bonnet Ridge
- 183 Honeybee Trace
- 123 Honeybee Trace
- 150 Honeybee Trace
- 79 Scotch Bonnet Ridge
- 137 Honeybee Trace
- 15 Scotch Bonnet Ridge
- 158 Honeybee Trace
- 85 Scotch Bonnet Ridge
- 149 Honeybee Trace
- 48 Scotch Bonnet Ridge