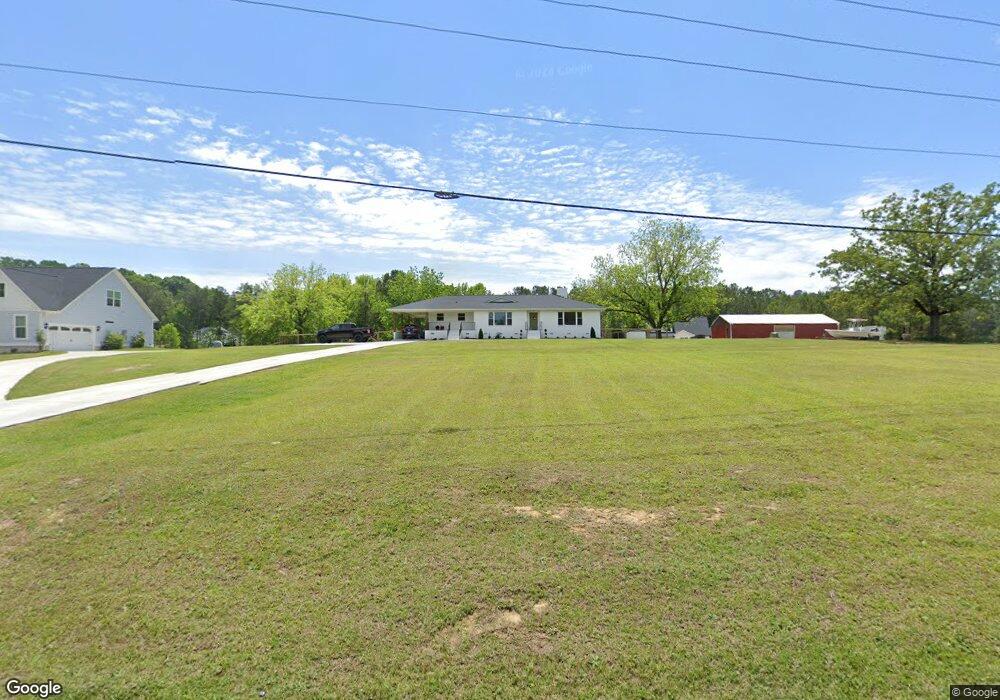
116 Jake Meetze Rd Chapin, SC 29036
Estimated Value: $353,000 - $443,000
3
Beds
2
Baths
2,058
Sq Ft
$193/Sq Ft
Est. Value
About This Home
This home is located at 116 Jake Meetze Rd, Chapin, SC 29036 and is currently estimated at $398,000, approximately $193 per square foot. 116 Jake Meetze Rd is a home located in Lexington County with nearby schools including Lake Murray Elementary School, Chapin Intermediate, and Chapin High School.
Ownership History
Date
Name
Owned For
Owner Type
Purchase Details
Closed on
Apr 13, 2020
Sold by
Hobbs Bethany and Hobbs Steve
Bought by
Cmh Homes Inc
Current Estimated Value
Purchase Details
Closed on
Mar 31, 2020
Sold by
Monts Norman W
Bought by
Monts Deborah W and Monts Edward Clinton
Purchase Details
Closed on
Oct 28, 2019
Sold by
Monts Norman
Bought by
Hobbs Bethany and Hobbs Steve
Purchase Details
Closed on
Jun 11, 2015
Sold by
Monts Norman W
Bought by
Clark Gary W and Clark Cynthia B
Create a Home Valuation Report for This Property
The Home Valuation Report is an in-depth analysis detailing your home's value as well as a comparison with similar homes in the area
Home Values in the Area
Average Home Value in this Area
Purchase History
| Date | Buyer | Sale Price | Title Company |
|---|---|---|---|
| Cmh Homes Inc | $9,545 | None Available | |
| Monts Deborah W | -- | None Available | |
| Hobbs Bethany | -- | None Available | |
| Clark Gary W | $15,000 | -- |
Source: Public Records
Tax History Compared to Growth
Tax History
| Year | Tax Paid | Tax Assessment Tax Assessment Total Assessment is a certain percentage of the fair market value that is determined by local assessors to be the total taxable value of land and additions on the property. | Land | Improvement |
|---|---|---|---|---|
| 2024 | $1,398 | $11,484 | $5,120 | $6,364 |
| 2023 | $1,398 | $11,484 | $5,120 | $6,364 |
| 2022 | $1,422 | $11,484 | $5,120 | $6,364 |
| 2020 | $1,492 | $11,484 | $5,120 | $6,364 |
| 2019 | $65 | $6,870 | $746 | $6,124 |
| 2018 | $644 | $6,870 | $746 | $6,124 |
| 2017 | $583 | $6,579 | $746 | $5,833 |
| 2016 | $605 | $6,579 | $746 | $5,833 |
| 2014 | $137 | $903 | $703 | $200 |
| 2013 | -- | $900 | $700 | $200 |
Source: Public Records
Map
Nearby Homes
- 143 Doolittle Dr
- 533 Mitscher Way
- 516 Mitscher Way
- 454 Brookridge Dr
- 362 Rising Stream Way
- 450 Brookridge Dr Unit LOT 55
- 366 Rising Stream Way
- 343 Rising Stream Way
- 337 Rising Stream Way
- 345 Rising Stream Way
- 387 Rising Stream Way
- 322 Rising Stream Way
- 407 Rising Stream Way
- 323 Rising Stream Way
- 239 Pebblebranch Dr
- 318 Rising Stream Way
- 415 Rising Stream Way
- 315 Rising Stream Way
- 419 Rising Stream Way
- 314 Rising Stream Way
- 306 Jake Meetze Rd
- 220 Jake Meetze Rd
- 0 Lemonts Rd
- 228 Jake Meetze Rd
- 325 Hill Haven Rd
- 210 Jake Meetze Rd
- 322 Hill Haven Rd
- 237 Jake Meetze Rd
- 202 Jake Meetze Rd
- 332 Jake Meetze Rd
- 217 Jake Meetze Rd
- 213 Jake Meetze Rd
- 209 Jake Meetze Rd
- 107 Lost Lure Ln
- 113 Lost Lure Ln
- 117 Lost Lure Ln
- 326 Lemonts Rd
- 102 Lost Lure Ln
- 207 Jake Meetze Rd
- 121 Lost Lure Ln