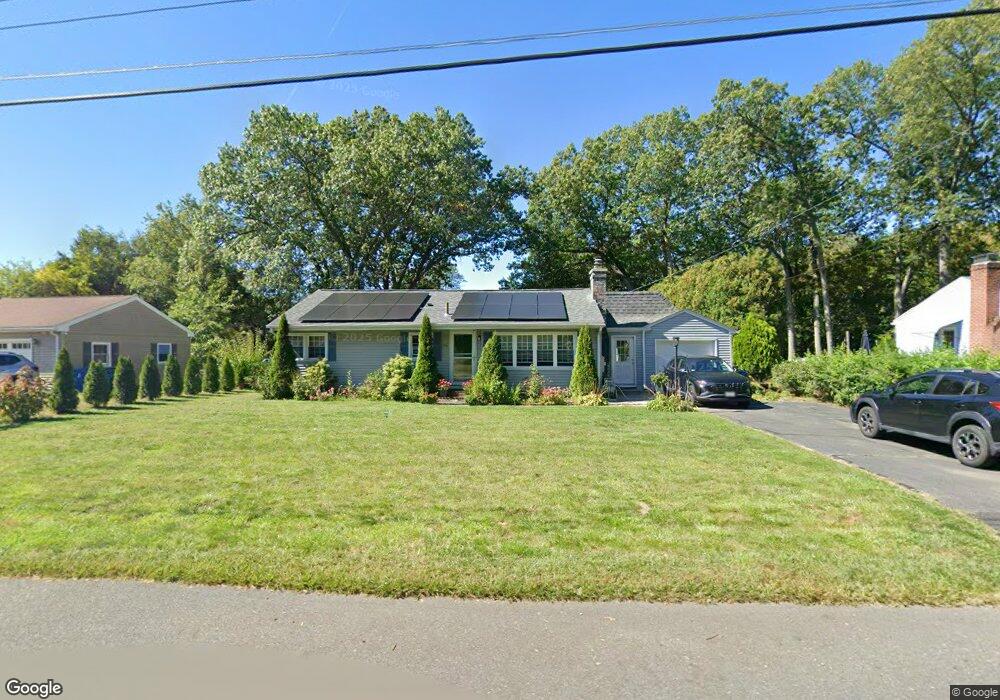
116 Jensen Cir West Springfield, MA 01089
Estimated Value: $350,000 - $395,000
2
Beds
1
Bath
1,240
Sq Ft
$294/Sq Ft
Est. Value
About This Home
This home is located at 116 Jensen Cir, West Springfield, MA 01089 and is currently estimated at $364,616, approximately $294 per square foot. 116 Jensen Cir is a home located in Hampden County with nearby schools including West Springfield High School, Hampden Charter School of Science West, and St Thomas The Apostle School.
Ownership History
Date
Name
Owned For
Owner Type
Purchase Details
Closed on
Dec 15, 2017
Sold by
Taskey John J and Taskey Mary C
Bought by
Bishop Jamie
Current Estimated Value
Home Financials for this Owner
Home Financials are based on the most recent Mortgage that was taken out on this home.
Original Mortgage
$173,600
Outstanding Balance
$147,537
Interest Rate
3.94%
Mortgage Type
New Conventional
Estimated Equity
$217,079
Purchase Details
Closed on
Jun 15, 2016
Sold by
Est Anti Ernest A and Pellegrino Nancy L
Bought by
Taskey John J and Taskey Mary C
Home Financials for this Owner
Home Financials are based on the most recent Mortgage that was taken out on this home.
Original Mortgage
$149,000
Interest Rate
3.61%
Mortgage Type
Commercial
Create a Home Valuation Report for This Property
The Home Valuation Report is an in-depth analysis detailing your home's value as well as a comparison with similar homes in the area
Home Values in the Area
Average Home Value in this Area
Purchase History
| Date | Buyer | Sale Price | Title Company |
|---|---|---|---|
| Bishop Jamie | $217,000 | -- | |
| Taskey John J | $145,000 | -- |
Source: Public Records
Mortgage History
| Date | Status | Borrower | Loan Amount |
|---|---|---|---|
| Open | Bishop Jamie | $173,600 | |
| Previous Owner | Taskey John J | $149,000 |
Source: Public Records
Tax History
| Year | Tax Paid | Tax Assessment Tax Assessment Total Assessment is a certain percentage of the fair market value that is determined by local assessors to be the total taxable value of land and additions on the property. | Land | Improvement |
|---|---|---|---|---|
| 2025 | $4,144 | $278,700 | $108,800 | $169,900 |
| 2024 | $4,088 | $276,000 | $108,800 | $167,200 |
| 2023 | $3,890 | $250,300 | $108,800 | $141,500 |
| 2022 | $3,511 | $222,800 | $98,800 | $124,000 |
| 2021 | $3,620 | $214,200 | $91,900 | $122,300 |
| 2020 | $3,323 | $195,600 | $91,900 | $103,700 |
| 2019 | $3,317 | $195,600 | $91,900 | $103,700 |
| 2018 | $3,335 | $195,600 | $91,900 | $103,700 |
| 2017 | $3,362 | $197,200 | $91,900 | $105,300 |
| 2016 | $3,291 | $193,700 | $88,400 | $105,300 |
| 2015 | $3,226 | $189,900 | $86,500 | $103,400 |
| 2014 | $789 | $189,900 | $86,500 | $103,400 |
Source: Public Records
Map
Nearby Homes
- 0 Ahiska Rd Unit 73477754
- 750 Amostown Rd
- 404 Brush Hill Ave
- 36 Shady Brook
- 67 Redden Rd
- 34 High Meadow Dr
- 2 Windpath E
- 11 Annie's Way
- 240 Morton St
- 61 Clarence St
- 88 Verdugo St
- 361 Prospect Ave
- 65 Verdugo St
- 917 Elm St
- 62 Talcott Ave
- 10 Beauregard Terrace
- 20-22 Gay Terrace
- 51-53 Abbe Ave
- 32 Maple St
- 81 Chestnut St
Your Personal Tour Guide
Ask me questions while you tour the home.