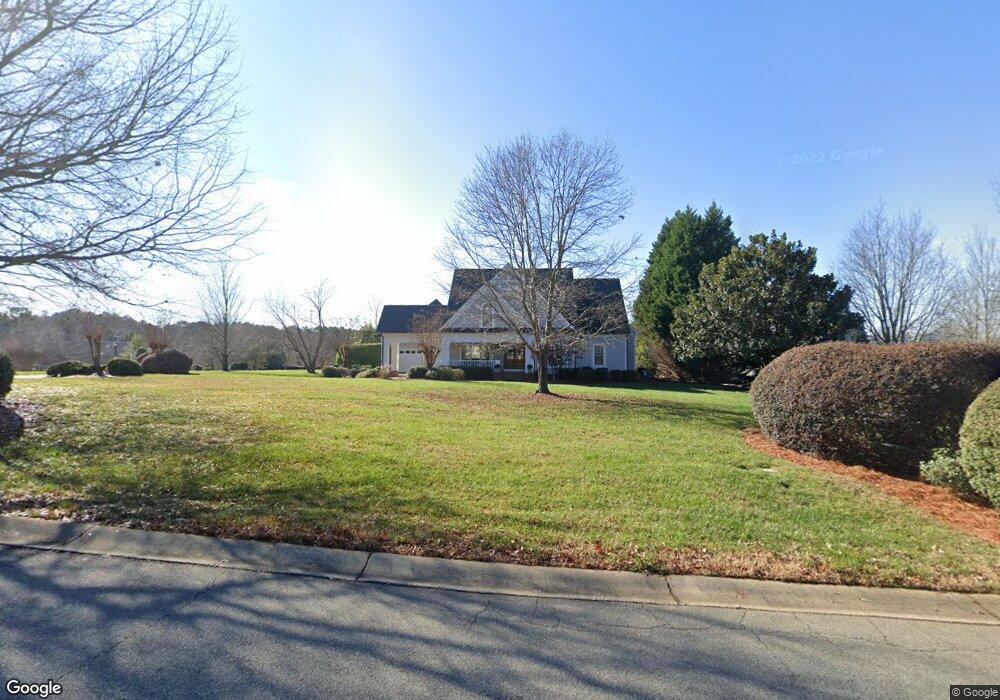
116 Jeremy Point Place Mooresville, NC 28117
Estimated Value: $1,304,644 - $1,889,000
4
Beds
4
Baths
3,668
Sq Ft
$426/Sq Ft
Est. Value
About This Home
This home is located at 116 Jeremy Point Place, Mooresville, NC 28117 and is currently estimated at $1,563,411, approximately $426 per square foot. 116 Jeremy Point Place is a home located in Iredell County with nearby schools including Woodland Heights Elementary School and Lake Norman High School.
Ownership History
Date
Name
Owned For
Owner Type
Purchase Details
Closed on
Mar 3, 2014
Sold by
Garabato Manolito and Garabato Deborah A
Bought by
Ladd Gregory C and Ladd Janet M
Current Estimated Value
Purchase Details
Closed on
Aug 5, 2002
Sold by
Hughes Hamelink Zande Builders Inc
Bought by
Garabato Manolito and Garabato Deborah A
Home Financials for this Owner
Home Financials are based on the most recent Mortgage that was taken out on this home.
Original Mortgage
$506,000
Interest Rate
5.5%
Mortgage Type
Commercial
Purchase Details
Closed on
Oct 6, 2000
Sold by
The Point On Norman Llc
Bought by
Hughes Hamelink Zande Builders Inc
Home Financials for this Owner
Home Financials are based on the most recent Mortgage that was taken out on this home.
Original Mortgage
$71,250
Interest Rate
7.97%
Mortgage Type
Commercial
Create a Home Valuation Report for This Property
The Home Valuation Report is an in-depth analysis detailing your home's value as well as a comparison with similar homes in the area
Home Values in the Area
Average Home Value in this Area
Purchase History
| Date | Buyer | Sale Price | Title Company |
|---|---|---|---|
| Ladd Gregory C | $695,000 | None Available | |
| Garabato Manolito | $632,500 | -- | |
| Hughes Hamelink Zande Builders Inc | $95,000 | -- |
Source: Public Records
Mortgage History
| Date | Status | Borrower | Loan Amount |
|---|---|---|---|
| Previous Owner | Garabato Manolito | $506,000 | |
| Previous Owner | Hughes Hamelink Zande Builders Inc | $71,250 | |
| Closed | Hughes Hamelink Zande Builders Inc | $23,750 | |
| Closed | Garabato Manolito | $90,250 |
Source: Public Records
Tax History Compared to Growth
Tax History
| Year | Tax Paid | Tax Assessment Tax Assessment Total Assessment is a certain percentage of the fair market value that is determined by local assessors to be the total taxable value of land and additions on the property. | Land | Improvement |
|---|---|---|---|---|
| 2024 | $5,849 | $981,150 | $230,000 | $751,150 |
| 2023 | $5,849 | $981,150 | $230,000 | $751,150 |
| 2022 | $4,675 | $736,030 | $143,750 | $592,280 |
| 2021 | $4,675 | $736,030 | $143,750 | $592,280 |
| 2020 | $4,416 | $694,750 | $143,750 | $551,000 |
| 2019 | $4,346 | $694,750 | $143,750 | $551,000 |
| 2018 | $4,150 | $685,790 | $143,750 | $542,040 |
| 2017 | $4,150 | $685,790 | $143,750 | $542,040 |
| 2016 | $4,150 | $685,790 | $143,750 | $542,040 |
| 2015 | -- | $685,790 | $143,750 | $542,040 |
| 2014 | -- | $599,710 | $143,750 | $455,960 |
Source: Public Records
Map
Nearby Homes
- 133 Brick Kiln Way
- 142 Jeremy Point Place
- 115 Union Chapel Dr
- 143 Jeremy Point Place
- 1946 Brawley School Rd
- 168 Brownstone Dr
- 106 Ballston Dr
- 184 Vineyard Dr Unit 52
- 166 White Horse Dr
- 121 Marstons Mill Dr
- 126 Silver Eagle Ln
- 102 Eastham Ct
- 175 Rehoboth Ln
- 173 Rehoboth Ln
- 108 Great Point Dr
- 111 Kent Ct
- 115 Jonquil Ct
- 235 Milford Cir
- 166 Atlantic Way
- 124 Lightship Dr
- 115 Brick Kiln Way
- NA Brick Kiln Way Unit 517
- 106 Brick Kiln Way
- 125 Brick Kiln Way
- 104 Masthead Ct
- LT#526 Brick Kiln Way
- 125 Jeremy Point Place
- 173 Polpis Rd
- 103 Masthead Ct
- 131 Jeremy Point Place
- 106 Masthead Ct
- 139 Brick Kiln Way
- 105 Masthead Ct
- 124 Brick Kiln Way
- 137 Jeremy Point Place
- 174 Polpis Rd Unit 513
- 174 Polpis Rd
- 130 Brick Kiln Way Unit 523
- 145 Brick Kiln Way
- 138 Brick Kiln Way