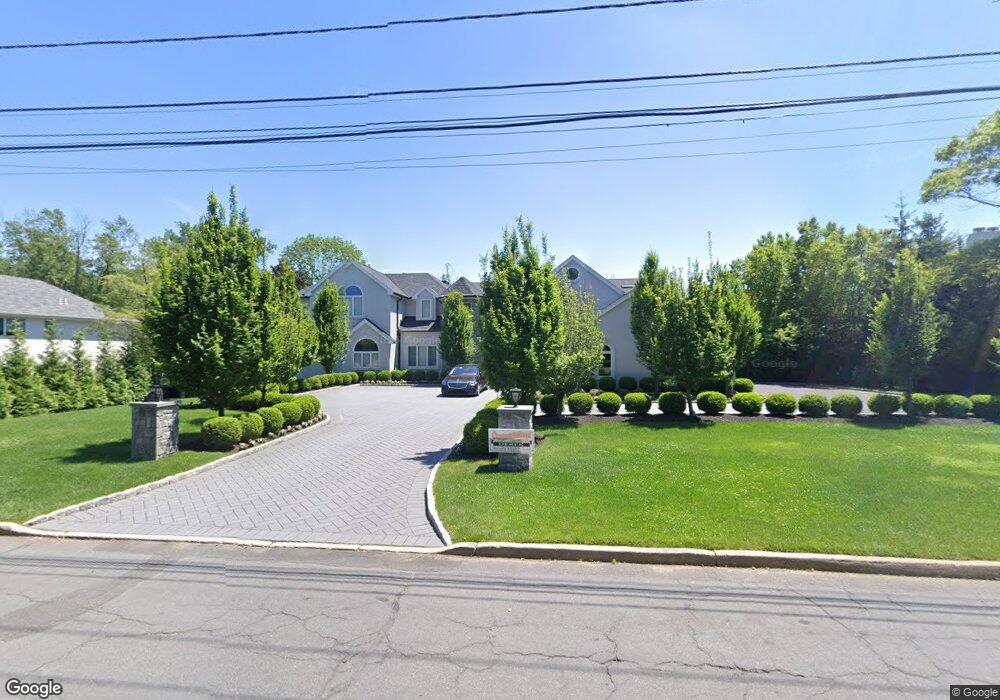
116 Kent Rd Tenafly, NJ 07670
Estimated Value: $3,549,071 - $4,515,000
5
Beds
7
Baths
6,638
Sq Ft
$605/Sq Ft
Est. Value
About This Home
This home is located at 116 Kent Rd, Tenafly, NJ 07670 and is currently estimated at $4,016,690, approximately $605 per square foot. 116 Kent Rd is a home located in Bergen County with nearby schools including Tenafly Middle School, Tenafly High School, and The Elisabeth Morrow School.
Ownership History
Date
Name
Owned For
Owner Type
Purchase Details
Closed on
Aug 10, 2017
Sold by
Rosen Mark and Rosen Nikki
Bought by
Hong David and Park Yeon
Current Estimated Value
Home Financials for this Owner
Home Financials are based on the most recent Mortgage that was taken out on this home.
Original Mortgage
$2,191,000
Outstanding Balance
$1,831,662
Interest Rate
4.03%
Mortgage Type
New Conventional
Estimated Equity
$2,185,028
Purchase Details
Closed on
May 5, 1999
Sold by
Kagan Richard Mark and Kagan Ivy Ann
Bought by
Rosen Mark and Rosen Nikki
Home Financials for this Owner
Home Financials are based on the most recent Mortgage that was taken out on this home.
Original Mortgage
$680,000
Interest Rate
6.85%
Create a Home Valuation Report for This Property
The Home Valuation Report is an in-depth analysis detailing your home's value as well as a comparison with similar homes in the area
Home Values in the Area
Average Home Value in this Area
Purchase History
| Date | Buyer | Sale Price | Title Company |
|---|---|---|---|
| Hong David | $2,300,000 | None Available | |
| Rosen Mark | $850,000 | Ticor Title Insurance Compan |
Source: Public Records
Mortgage History
| Date | Status | Borrower | Loan Amount |
|---|---|---|---|
| Open | Hong David | $2,191,000 | |
| Previous Owner | Rosen Mark | $680,000 |
Source: Public Records
Tax History
| Year | Tax Paid | Tax Assessment Tax Assessment Total Assessment is a certain percentage of the fair market value that is determined by local assessors to be the total taxable value of land and additions on the property. | Land | Improvement |
|---|---|---|---|---|
| 2025 | $59,661 | $2,100,000 | $1,089,300 | $1,010,700 |
| 2024 | $63,340 | $2,100,000 | $1,089,300 | $1,010,700 |
| 2023 | $61,809 | $2,285,000 | $1,089,300 | $1,195,700 |
| 2022 | $61,809 | $2,285,000 | $1,089,300 | $1,195,700 |
| 2021 | $63,997 | $2,408,600 | $1,089,300 | $1,319,300 |
| 2020 | $63,057 | $2,408,600 | $1,089,300 | $1,319,300 |
| 2019 | $61,949 | $2,408,600 | $1,089,300 | $1,319,300 |
| 2018 | $52,076 | $2,056,700 | $1,089,300 | $967,400 |
| 2017 | $55,675 | $2,206,700 | $1,089,300 | $1,117,400 |
| 2016 | $54,572 | $2,206,700 | $1,089,300 | $1,117,400 |
| 2015 | $53,358 | $2,206,700 | $1,089,300 | $1,117,400 |
| 2014 | $52,365 | $2,206,700 | $1,089,300 | $1,117,400 |
Source: Public Records
Map
Nearby Homes
Your Personal Tour Guide
Ask me questions while you tour the home.