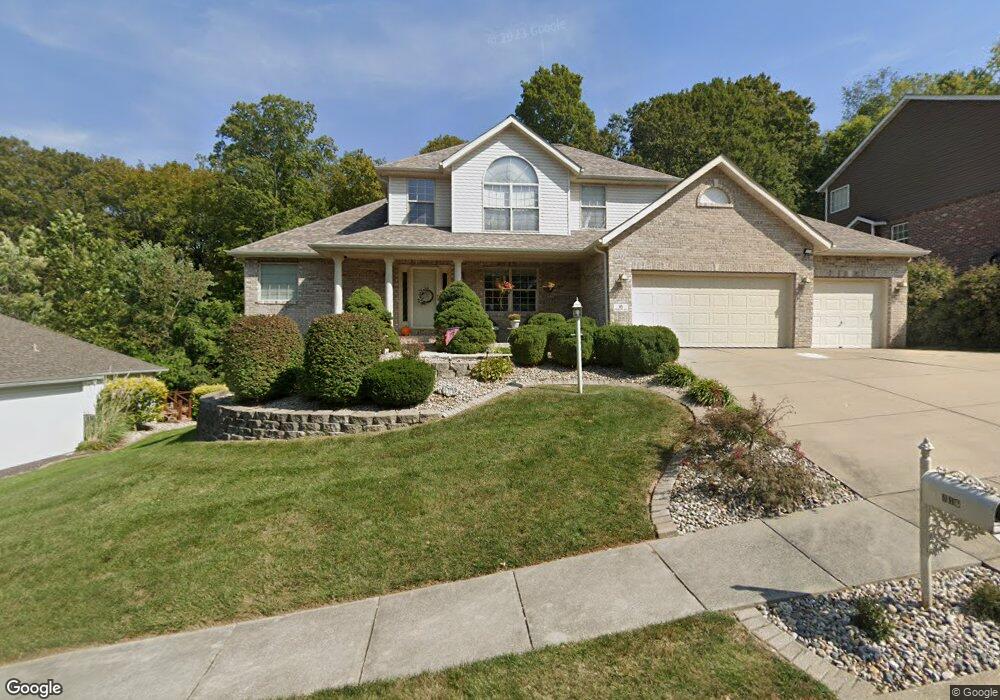
116 Kingsbrooke Blvd Glen Carbon, IL 62034
Estimated Value: $341,000 - $479,000
2
Beds
4
Baths
649
Sq Ft
$655/Sq Ft
Est. Value
About This Home
This home is located at 116 Kingsbrooke Blvd, Glen Carbon, IL 62034 and is currently estimated at $425,222, approximately $655 per square foot. 116 Kingsbrooke Blvd is a home located in Madison County with nearby schools including Glen Carbon Elementary School, Albert Cassens Elementary School, and Liberty Middle School.
Ownership History
Date
Name
Owned For
Owner Type
Purchase Details
Closed on
Dec 21, 2012
Sold by
Szedlar Brad C and Szedlar Kathryn M
Bought by
Szedlar Kathryn M
Current Estimated Value
Home Financials for this Owner
Home Financials are based on the most recent Mortgage that was taken out on this home.
Original Mortgage
$156,300
Outstanding Balance
$27,545
Interest Rate
2.63%
Mortgage Type
New Conventional
Estimated Equity
$397,677
Purchase Details
Closed on
Sep 29, 2003
Sold by
Dittrich Jospeh L and Dittrich Joani J
Bought by
Szedlar Brad C and Szedlar Kathryn M
Home Financials for this Owner
Home Financials are based on the most recent Mortgage that was taken out on this home.
Original Mortgage
$198,400
Interest Rate
5.72%
Mortgage Type
Purchase Money Mortgage
Create a Home Valuation Report for This Property
The Home Valuation Report is an in-depth analysis detailing your home's value as well as a comparison with similar homes in the area
Home Values in the Area
Average Home Value in this Area
Purchase History
| Date | Buyer | Sale Price | Title Company |
|---|---|---|---|
| Szedlar Kathryn M | -- | First American Title Insuran | |
| Szedlar Brad C | $255,000 | -- |
Source: Public Records
Mortgage History
| Date | Status | Borrower | Loan Amount |
|---|---|---|---|
| Open | Szedlar Kathryn M | $156,300 | |
| Previous Owner | Szedlar Brad C | $198,400 | |
| Closed | Szedlar Brad C | $24,800 |
Source: Public Records
Tax History Compared to Growth
Tax History
| Year | Tax Paid | Tax Assessment Tax Assessment Total Assessment is a certain percentage of the fair market value that is determined by local assessors to be the total taxable value of land and additions on the property. | Land | Improvement |
|---|---|---|---|---|
| 2024 | $8,160 | $121,830 | $23,410 | $98,420 |
| 2023 | $8,160 | $113,050 | $21,720 | $91,330 |
| 2022 | $7,742 | $104,500 | $20,080 | $84,420 |
| 2021 | $7,464 | $99,190 | $19,060 | $80,130 |
| 2020 | $7,267 | $96,120 | $18,470 | $77,650 |
| 2019 | $7,196 | $94,510 | $18,160 | $76,350 |
| 2018 | $7,080 | $90,260 | $17,340 | $72,920 |
| 2017 | $6,989 | $88,350 | $16,970 | $71,380 |
| 2016 | $6,343 | $88,350 | $16,970 | $71,380 |
| 2015 | $5,496 | $81,910 | $15,740 | $66,170 |
| 2014 | $5,496 | $81,910 | $15,740 | $66,170 |
| 2013 | $5,496 | $81,910 | $15,740 | $66,170 |
Source: Public Records
Map
Nearby Homes
- 5 Chariot Ct
- 109 Kingsbrooke Blvd
- 126 Kingsbrooke Blvd
- 0 Route 159
- 204 Aspen Point
- 14 Lou Juan Dr
- 24 Alta St
- 505 Huntington
- 671 Glen Crossing Rd
- 71 Hillsborough Ave
- 53 Cheshire Dr
- 0 S State Route 159
- 6 Shaderest Ct
- 17 Waterford Ln
- 10 Dunbridge Ct
- 4519 Bruin Ln
- 77 Kingsley Way
- 6480 Green Acres
- 6817 Bouse Rd
- 1 Pioneer Trail
- 114 Kingsbrooke Blvd
- 118 Kingsbrooke Blvd
- 120 Kingsbrooke Blvd
- 117 Kingsbrooke Blvd
- 122 Kingsbrooke Blvd
- 110 Kingsbrooke Blvd
- 9 Chariot Ct
- 107 Kingsbrooke Blvd
- 123 Kingsbrooke Blvd
- 108 Kingsbrooke Blvd
- 124 Kingsbrooke Blvd
- 6 Chariot Ct
- 10 Chariot Ct
- 125 Kingsbrooke Blvd
- 106 Kingsbrooke Blvd
- 105 Kingsbrooke Blvd
- 2 E 30 Trailer Park
- 103 Kingsbrooke Blvd
- 128 Kingsbrooke Blvd
- 9 Kingsbury Ct