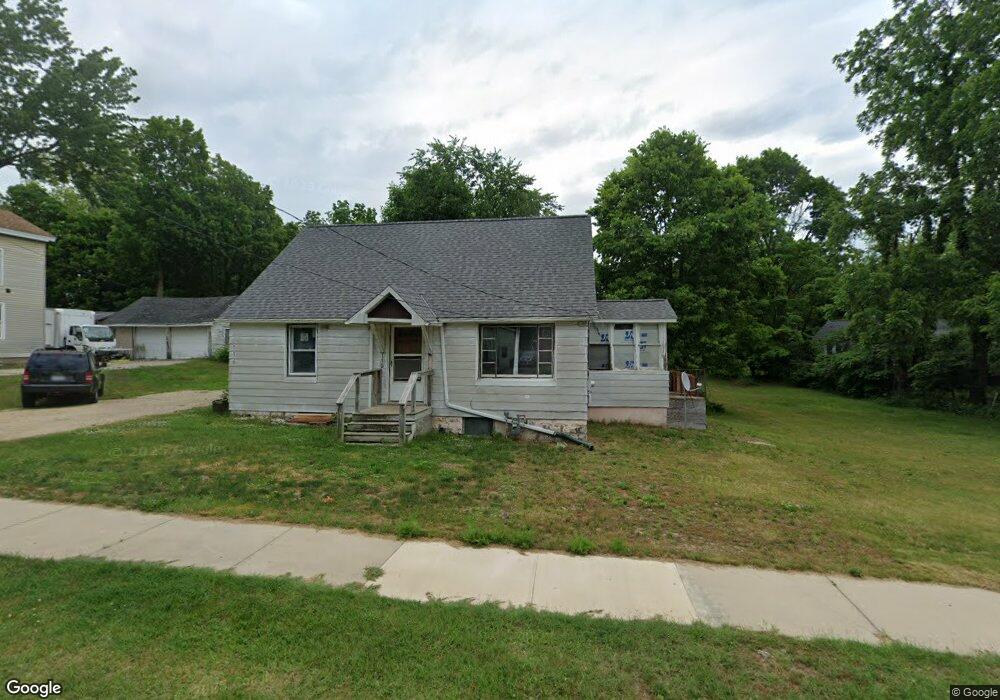
116 Knapp St Allegan, MI 49010
Estimated Value: $173,435 - $187,000
--
Bed
1
Bath
1,200
Sq Ft
$149/Sq Ft
Est. Value
About This Home
This home is located at 116 Knapp St, Allegan, MI 49010 and is currently estimated at $179,109, approximately $149 per square foot. 116 Knapp St is a home located in Allegan County with nearby schools including West Ward Elementary School, L.E. White Middle School, and Allegan High School.
Ownership History
Date
Name
Owned For
Owner Type
Purchase Details
Closed on
Feb 20, 2009
Sold by
Blood Jerry L and Blood James C
Bought by
Tyrrell Aaron L and Tyrrell Joi N
Current Estimated Value
Home Financials for this Owner
Home Financials are based on the most recent Mortgage that was taken out on this home.
Original Mortgage
$39,265
Outstanding Balance
$24,567
Interest Rate
4.91%
Mortgage Type
Purchase Money Mortgage
Estimated Equity
$154,542
Purchase Details
Closed on
Apr 26, 1995
Sold by
Blood Clyde K and Blood Maida M
Bought by
Blood Jerry L and Blood James C
Create a Home Valuation Report for This Property
The Home Valuation Report is an in-depth analysis detailing your home's value as well as a comparison with similar homes in the area
Home Values in the Area
Average Home Value in this Area
Purchase History
| Date | Buyer | Sale Price | Title Company |
|---|---|---|---|
| Tyrrell Aaron L | $37,500 | Chicago Title | |
| Blood Jerry L | -- | -- |
Source: Public Records
Mortgage History
| Date | Status | Borrower | Loan Amount |
|---|---|---|---|
| Open | Tyrrell Aaron L | $39,265 |
Source: Public Records
Tax History Compared to Growth
Tax History
| Year | Tax Paid | Tax Assessment Tax Assessment Total Assessment is a certain percentage of the fair market value that is determined by local assessors to be the total taxable value of land and additions on the property. | Land | Improvement |
|---|---|---|---|---|
| 2025 | $1,300 | $66,400 | $30,000 | $36,400 |
| 2024 | $1,183 | $64,300 | $28,800 | $35,500 |
| 2023 | $1,225 | $56,900 | $27,000 | $29,900 |
| 2022 | $1,183 | $48,100 | $22,800 | $25,300 |
| 2021 | $1,131 | $42,500 | $18,000 | $24,500 |
| 2020 | $1,115 | $41,900 | $15,000 | $26,900 |
| 2019 | $1,087 | $35,200 | $11,900 | $23,300 |
| 2018 | $1,044 | $32,300 | $11,900 | $20,400 |
| 2017 | $0 | $29,200 | $10,100 | $19,100 |
| 2016 | $0 | $24,200 | $9,000 | $15,200 |
| 2015 | -- | $24,200 | $9,000 | $15,200 |
| 2014 | -- | $22,900 | $7,200 | $15,700 |
| 2013 | $1,320 | $23,400 | $7,200 | $16,200 |
Source: Public Records
Map
Nearby Homes