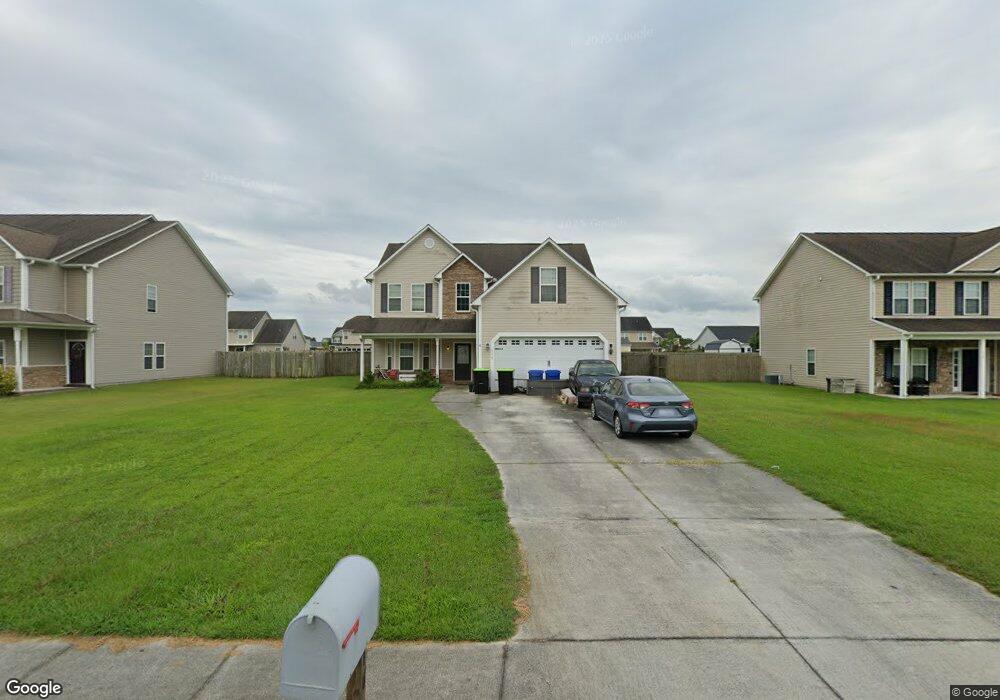
116 Landover Dr Richlands, NC 28574
Estimated Value: $203,000 - $367,000
5
Beds
3
Baths
2,618
Sq Ft
$106/Sq Ft
Est. Value
About This Home
This home is located at 116 Landover Dr, Richlands, NC 28574 and is currently estimated at $278,353, approximately $106 per square foot. 116 Landover Dr is a home located in Onslow County with nearby schools including Richlands Elementary School, Trexler Middle School, and Richlands High School.
Ownership History
Date
Name
Owned For
Owner Type
Purchase Details
Closed on
Mar 5, 2025
Sold by
Sosnowski Jeffrey Alan and Sosnowski Denise
Bought by
Throne Robert and Throne Vicky Sue
Current Estimated Value
Home Financials for this Owner
Home Financials are based on the most recent Mortgage that was taken out on this home.
Original Mortgage
$200,000
Outstanding Balance
$198,980
Interest Rate
6.89%
Mortgage Type
VA
Estimated Equity
$79,373
Purchase Details
Closed on
Mar 28, 2014
Sold by
Sosnowski Amelia Corinne
Bought by
Sosnowski Jeffrey Alan
Purchase Details
Closed on
Jun 3, 2011
Sold by
T & R Builders Of North Carolina Inc
Bought by
Sosnowski Jeffrey A and Sosnowski Amelia
Home Financials for this Owner
Home Financials are based on the most recent Mortgage that was taken out on this home.
Original Mortgage
$221,050
Interest Rate
4.79%
Mortgage Type
VA
Purchase Details
Closed on
Apr 7, 2010
Sold by
Rhc Construction & Realty Inc
Bought by
T & R Builders Of North Carolina Inc
Create a Home Valuation Report for This Property
The Home Valuation Report is an in-depth analysis detailing your home's value as well as a comparison with similar homes in the area
Home Values in the Area
Average Home Value in this Area
Purchase History
| Date | Buyer | Sale Price | Title Company |
|---|---|---|---|
| Throne Robert | $200,000 | None Listed On Document | |
| Sosnowski Jeffrey Alan | -- | None Available | |
| Sosnowski Jeffrey A | $215,500 | None Available | |
| T & R Builders Of North Carolina Inc | $175,000 | None Available |
Source: Public Records
Mortgage History
| Date | Status | Borrower | Loan Amount |
|---|---|---|---|
| Open | Throne Robert | $200,000 | |
| Previous Owner | Sosnowski Jeffrey A | $221,050 |
Source: Public Records
Tax History
| Year | Tax Paid | Tax Assessment Tax Assessment Total Assessment is a certain percentage of the fair market value that is determined by local assessors to be the total taxable value of land and additions on the property. | Land | Improvement |
|---|---|---|---|---|
| 2025 | $2,575 | $248,821 | $40,000 | $208,821 |
| 2024 | $2,575 | $248,821 | $40,000 | $208,821 |
| 2023 | $2,575 | $248,821 | $40,000 | $208,821 |
| 2022 | $2,575 | $248,821 | $40,000 | $208,821 |
| 2021 | $2,122 | $192,060 | $30,000 | $162,060 |
| 2020 | $2,122 | $192,060 | $30,000 | $162,060 |
| 2019 | $2,122 | $192,060 | $30,000 | $162,060 |
| 2018 | $2,084 | $192,060 | $30,000 | $162,060 |
| 2017 | $2,210 | $209,510 | $32,000 | $177,510 |
| 2016 | $2,210 | $209,510 | $0 | $0 |
| 2015 | $2,210 | $209,510 | $0 | $0 |
| 2014 | $2,210 | $209,510 | $0 | $0 |
Source: Public Records
Map
Nearby Homes
- 126 Landover Dr
- 624 S Squires Run Ln
- 628 S Squires Run Ln
- 127 Landover Dr
- 618 S Squires Run Ln
- 632 S Squires Run Ln
- 619 S Squires Run Ln
- 617 S Squires Run Ln
- 621 S Squires Run Ln
- 623 S Squires Run Ln
- 302 Esquire Dr
- 614 S Squires Run Ln
- 615 S Squires Run Ln
- 613 S Squires Run Ln
- 107 Airleigh Place
- 612 S Squires Run Ln
- 611 S Squires Run Ln
- 610 S Squires Run Ln
- 510 Bellefonte Ct
- 609 S Squires Run Ln
- 118 Landover Dr
- 114 Landover Dr
- 120 Landover Dr
- 112 Landover Dr
- 117 Groveshire Place
- 119 Groveshire Place
- 115 Groveshire Place
- 122 Landover Dr
- 110 Landover Dr
- 113 Groveshire Place
- 121 Groveshire Place
- 115 Landover Dr
- 117 Landover Dr
- 113 Landover Dr
- 111 Groveshire Place
- 124 Landover Dr
- 123 Groveshire Place
- 108 Landover Dr
- 119 Landover Dr
- 111 Landover Dr