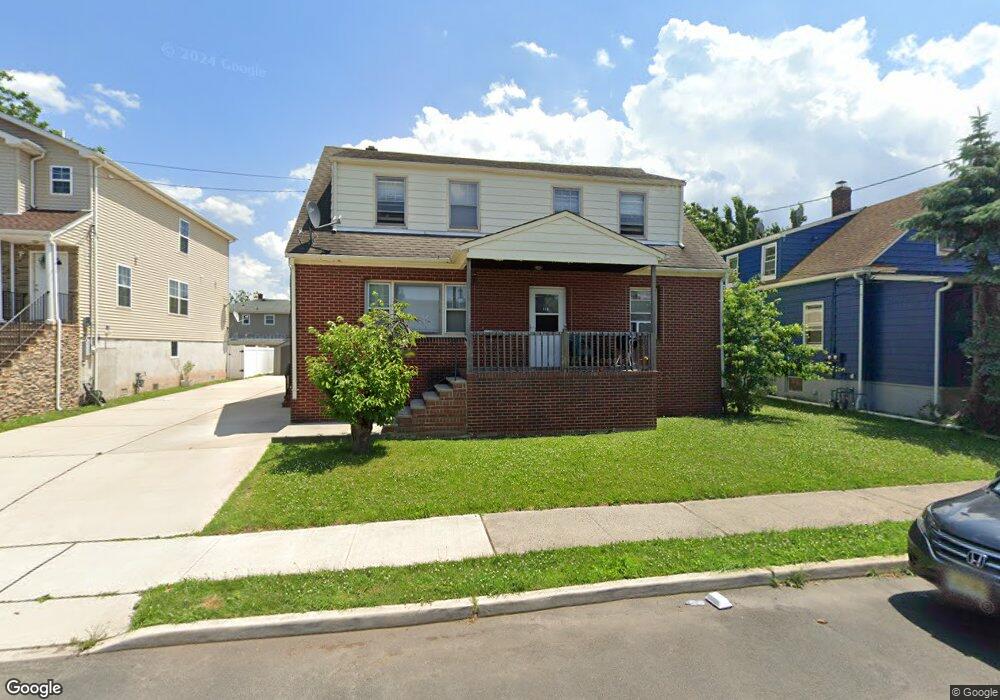
116 Linden St Carteret, NJ 07008
Estimated Value: $540,000 - $728,000
5
Beds
2
Baths
2,232
Sq Ft
$288/Sq Ft
Est. Value
About This Home
This home is located at 116 Linden St, Carteret, NJ 07008 and is currently estimated at $642,771, approximately $287 per square foot. 116 Linden St is a home located in Middlesex County with nearby schools including Carteret High School, St Joseph School, and St James School-Woodbridge.
Ownership History
Date
Name
Owned For
Owner Type
Purchase Details
Closed on
Nov 25, 2019
Sold by
Singh Balvir and Nahal Manjit K
Bought by
Nahal Manjit K
Current Estimated Value
Purchase Details
Closed on
May 19, 2014
Sold by
Sitar Olga and Sitar Moyer Janet
Bought by
Singh Balvir and Nahal Manjit K
Home Financials for this Owner
Home Financials are based on the most recent Mortgage that was taken out on this home.
Original Mortgage
$172,500
Outstanding Balance
$131,906
Interest Rate
4.42%
Mortgage Type
New Conventional
Estimated Equity
$510,865
Create a Home Valuation Report for This Property
The Home Valuation Report is an in-depth analysis detailing your home's value as well as a comparison with similar homes in the area
Home Values in the Area
Average Home Value in this Area
Purchase History
| Date | Buyer | Sale Price | Title Company |
|---|---|---|---|
| Nahal Manjit K | -- | None Available | |
| Singh Balvir | $230,000 | Multiple |
Source: Public Records
Mortgage History
| Date | Status | Borrower | Loan Amount |
|---|---|---|---|
| Open | Singh Balvir | $172,500 |
Source: Public Records
Tax History Compared to Growth
Tax History
| Year | Tax Paid | Tax Assessment Tax Assessment Total Assessment is a certain percentage of the fair market value that is determined by local assessors to be the total taxable value of land and additions on the property. | Land | Improvement |
|---|---|---|---|---|
| 2025 | $8,015 | $560,200 | $327,500 | $232,700 |
| 2024 | $7,808 | $251,400 | $90,000 | $161,400 |
| 2023 | $7,808 | $251,400 | $90,000 | $161,400 |
| 2022 | $7,592 | $251,400 | $90,000 | $161,400 |
| 2021 | $5,563 | $251,400 | $90,000 | $161,400 |
| 2020 | $7,230 | $251,400 | $90,000 | $161,400 |
| 2019 | $7,022 | $251,400 | $90,000 | $161,400 |
| 2018 | $6,856 | $251,400 | $90,000 | $161,400 |
| 2017 | $6,612 | $251,400 | $90,000 | $161,400 |
| 2016 | $6,872 | $217,000 | $80,000 | $137,000 |
| 2015 | $6,773 | $217,000 | $80,000 | $137,000 |
| 2014 | $6,227 | $217,000 | $80,000 | $137,000 |
Source: Public Records
Map
Nearby Homes