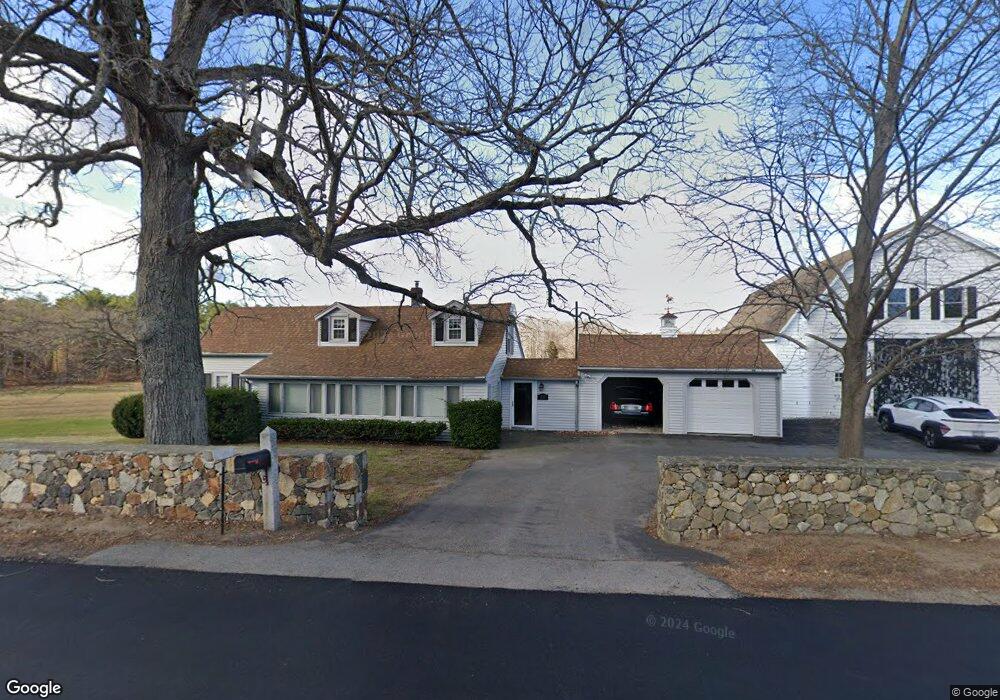
116 Main St Salisbury, MA 01952
Estimated Value: $585,066 - $704,000
2
Beds
2
Baths
2,326
Sq Ft
$287/Sq Ft
Est. Value
About This Home
This home is located at 116 Main St, Salisbury, MA 01952 and is currently estimated at $667,267, approximately $286 per square foot. 116 Main St is a home located in Essex County with nearby schools including Triton Regional High School and Amesbury Seventh-Day Adventist School.
Ownership History
Date
Name
Owned For
Owner Type
Purchase Details
Closed on
Jan 21, 2015
Sold by
116 Main St Rt and Tindle Robert F
Bought by
Tindle Robert F and Rindle Mary J
Current Estimated Value
Purchase Details
Closed on
Sep 30, 2008
Sold by
Tindle Mary Joan and Tindle Robert F
Bought by
Tindle Tr Robert F
Purchase Details
Closed on
Feb 1, 2007
Sold by
Tindle Mary Joan and Tindle Robert F
Bought by
Tindle Robert F
Create a Home Valuation Report for This Property
The Home Valuation Report is an in-depth analysis detailing your home's value as well as a comparison with similar homes in the area
Home Values in the Area
Average Home Value in this Area
Purchase History
| Date | Buyer | Sale Price | Title Company |
|---|---|---|---|
| Tindle Robert F | -- | -- | |
| Tindle Tr Robert F | -- | -- | |
| Tindle Robert F | -- | -- |
Source: Public Records
Mortgage History
| Date | Status | Borrower | Loan Amount |
|---|---|---|---|
| Previous Owner | Tindle Robert F | $250,000 |
Source: Public Records
Tax History
| Year | Tax Paid | Tax Assessment Tax Assessment Total Assessment is a certain percentage of the fair market value that is determined by local assessors to be the total taxable value of land and additions on the property. | Land | Improvement |
|---|---|---|---|---|
| 2025 | $4,714 | $467,700 | $175,000 | $292,700 |
| 2024 | $4,625 | $442,600 | $175,000 | $267,600 |
| 2023 | $4,549 | $421,200 | $175,000 | $246,200 |
| 2022 | $4,364 | $391,700 | $159,800 | $231,900 |
| 2021 | $4,317 | $383,400 | $159,800 | $223,600 |
| 2020 | $4,167 | $363,600 | $159,800 | $203,800 |
| 2019 | $4,232 | $356,800 | $160,500 | $196,300 |
| 2018 | $4,127 | $350,300 | $160,500 | $189,800 |
| 2017 | $3,774 | $316,600 | $138,700 | $177,900 |
| 2016 | $3,618 | $310,000 | $132,100 | $177,900 |
| 2015 | $3,550 | $302,100 | $131,400 | $170,700 |
Source: Public Records
Map
Nearby Homes
- 82 Monroe St
- 53 Rabbit Rd
- 9 Elmwood St
- 7 Toll Rd
- 25 Bayberry Ln
- 57 Baker Rd
- 21 Congress St
- 188 Lafayette Rd
- 154 Lafayette Rd
- 97 Elm St
- 25 Cedar St Unit 4
- 5 Russell St Unit 1
- 241 & 245 Lafayette Rd
- 149 Market St
- 191 Elm St
- 105 Market St Unit B
- 101 Market St Unit B
- 3 Birchwood Point Unit 202
- 4 Clark St
- 7 Birchwood Pointe Unit 101
Your Personal Tour Guide
Ask me questions while you tour the home.