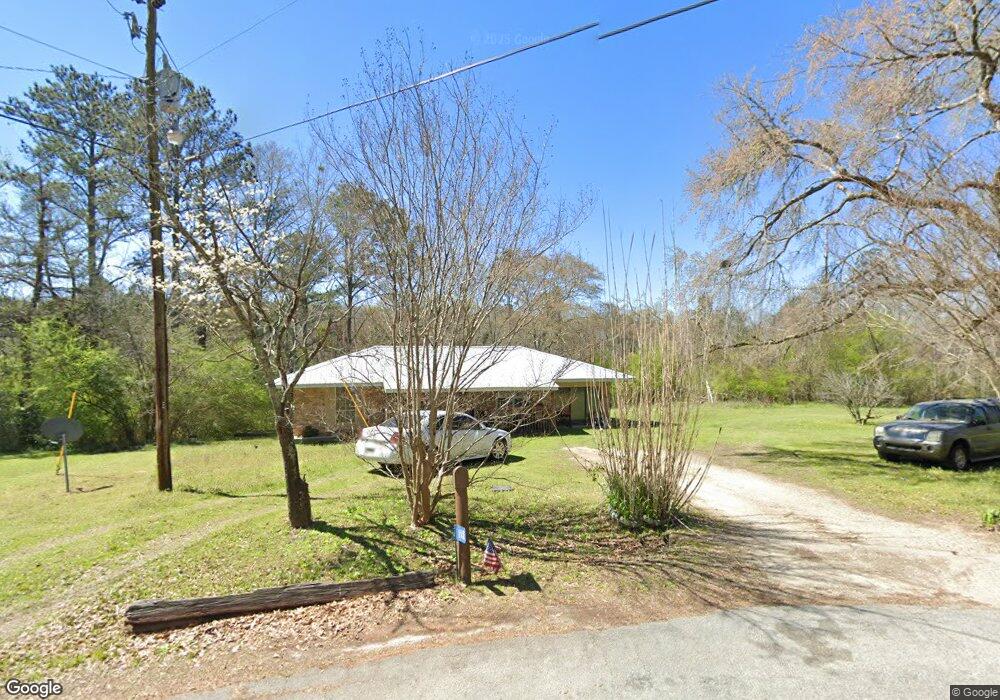
116 Maple Cir Greensboro, GA 30642
Estimated Value: $87,000 - $257,000
3
Beds
1
Bath
1,325
Sq Ft
$127/Sq Ft
Est. Value
About This Home
This home is located at 116 Maple Cir, Greensboro, GA 30642 and is currently estimated at $168,468, approximately $127 per square foot. 116 Maple Cir is a home located in Greene County with nearby schools including Greene County High School.
Ownership History
Date
Name
Owned For
Owner Type
Purchase Details
Closed on
Dec 28, 2009
Sold by
Talbot State Bank
Bought by
Turner Georeg C
Current Estimated Value
Home Financials for this Owner
Home Financials are based on the most recent Mortgage that was taken out on this home.
Original Mortgage
$27,550
Outstanding Balance
$8,352
Interest Rate
4.75%
Mortgage Type
Purchase Money Mortgage
Estimated Equity
$160,116
Purchase Details
Closed on
Dec 1, 2009
Sold by
Dunn Betty Jean and White Betty Y
Bought by
Talbot State Bank
Home Financials for this Owner
Home Financials are based on the most recent Mortgage that was taken out on this home.
Original Mortgage
$27,550
Outstanding Balance
$8,352
Interest Rate
4.75%
Mortgage Type
Purchase Money Mortgage
Estimated Equity
$160,116
Purchase Details
Closed on
Jul 21, 2006
Sold by
Dunn Betty Jean
Bought by
Dunn Betty Jean and White Betty Y
Purchase Details
Closed on
Jan 1, 1970
Bought by
White Albert E and White Betty B
Create a Home Valuation Report for This Property
The Home Valuation Report is an in-depth analysis detailing your home's value as well as a comparison with similar homes in the area
Home Values in the Area
Average Home Value in this Area
Purchase History
| Date | Buyer | Sale Price | Title Company |
|---|---|---|---|
| Turner Georeg C | $29,000 | -- | |
| Talbot State Bank | -- | -- | |
| Talbot State Bank | $26,289 | -- | |
| Dunn Betty Jean | -- | -- | |
| White Albert E | -- | -- |
Source: Public Records
Mortgage History
| Date | Status | Borrower | Loan Amount |
|---|---|---|---|
| Open | Turner Georeg C | $27,550 | |
| Closed | Talbot State Bank | $27,550 |
Source: Public Records
Tax History Compared to Growth
Tax History
| Year | Tax Paid | Tax Assessment Tax Assessment Total Assessment is a certain percentage of the fair market value that is determined by local assessors to be the total taxable value of land and additions on the property. | Land | Improvement |
|---|---|---|---|---|
| 2024 | $1,042 | $38,960 | $4,800 | $34,160 |
| 2023 | $783 | $36,200 | $4,800 | $31,400 |
| 2022 | $699 | $30,760 | $2,400 | $28,360 |
| 2021 | $661 | $27,080 | $2,400 | $24,680 |
| 2020 | $362 | $9,760 | $1,520 | $8,240 |
| 2019 | $370 | $9,760 | $1,520 | $8,240 |
| 2018 | $348 | $9,760 | $1,520 | $8,240 |
| 2017 | $334 | $9,776 | $1,530 | $8,246 |
| 2016 | $345 | $10,308 | $1,530 | $8,778 |
| 2015 | $315 | $10,308 | $1,530 | $8,778 |
| 2014 | $329 | $10,764 | $1,530 | $9,234 |
Source: Public Records
Map
Nearby Homes
- 0 Maple Cir
- 1061 Grimes St
- 314 W South St
- 208 W South St
- 15 South St Unit Siloam Road
- 301 N East St
- 805 S West St
- 1020 Horton Dr
- 504 Martin Luther King Junior Dr
- 0 Canaan St
- 0 Railroad St Unit 218854
- 0 Railroad St Unit 10578007
- 0 Railroad St Unit 531919
- 105 Wilson St
- 109 Reynolds Dr
- 1531 E Broad St
- 1060 Twin Pines Cir
- Lots 9-11 Town Creek Blvd
- Lot 8 Town Creek Blvd
- Lot 7 Town Creek Blvd