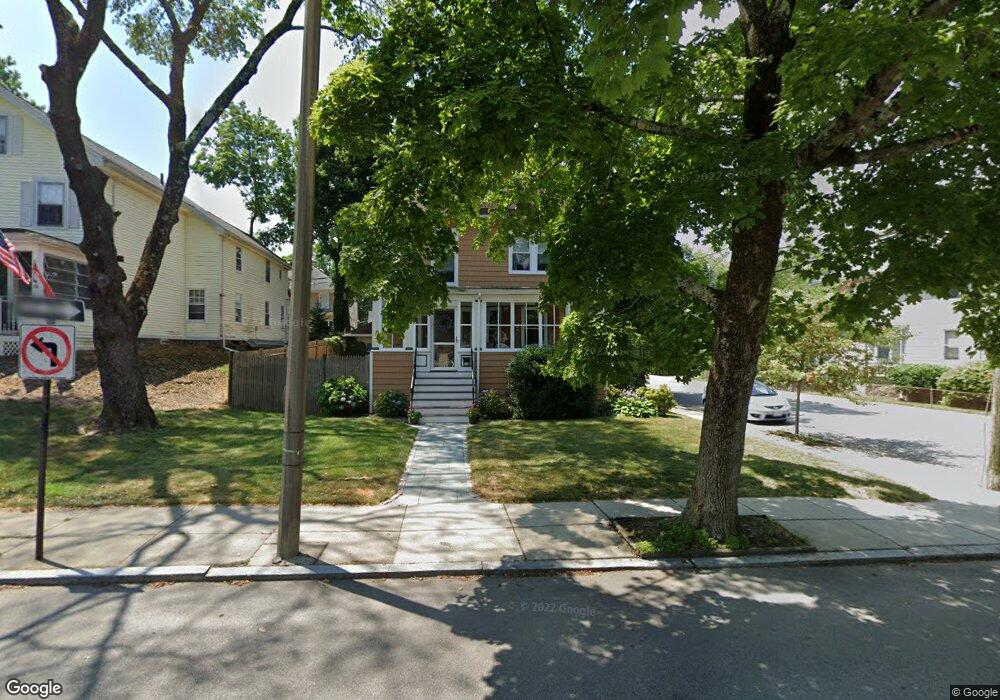
116 Maple St West Roxbury, MA 02132
West Roxbury NeighborhoodEstimated Value: $941,000 - $1,004,000
4
Beds
2
Baths
1,790
Sq Ft
$546/Sq Ft
Est. Value
About This Home
This home is located at 116 Maple St, West Roxbury, MA 02132 and is currently estimated at $978,003, approximately $546 per square foot. 116 Maple St is a home located in Suffolk County with nearby schools including Holy Name Parish School, St Theresa School, and The Roxbury Latin School.
Ownership History
Date
Name
Owned For
Owner Type
Purchase Details
Closed on
Jul 12, 1991
Sold by
Macvaugh Patricia Q
Bought by
Grant Robert A and Grant Barbara J
Current Estimated Value
Home Financials for this Owner
Home Financials are based on the most recent Mortgage that was taken out on this home.
Original Mortgage
$155,200
Interest Rate
9.35%
Mortgage Type
Purchase Money Mortgage
Purchase Details
Closed on
Apr 29, 1988
Sold by
Beyer Jeffrey C
Bought by
Macvaugh Patricia Q
Home Financials for this Owner
Home Financials are based on the most recent Mortgage that was taken out on this home.
Original Mortgage
$115,000
Interest Rate
9.86%
Mortgage Type
Purchase Money Mortgage
Create a Home Valuation Report for This Property
The Home Valuation Report is an in-depth analysis detailing your home's value as well as a comparison with similar homes in the area
Home Values in the Area
Average Home Value in this Area
Purchase History
| Date | Buyer | Sale Price | Title Company |
|---|---|---|---|
| Grant Robert A | $194,000 | -- | |
| Macvaugh Patricia Q | $221,000 | -- |
Source: Public Records
Mortgage History
| Date | Status | Borrower | Loan Amount |
|---|---|---|---|
| Closed | Grant Robert A | $155,200 | |
| Previous Owner | Macvaugh Patricia Q | $115,000 |
Source: Public Records
Tax History
| Year | Tax Paid | Tax Assessment Tax Assessment Total Assessment is a certain percentage of the fair market value that is determined by local assessors to be the total taxable value of land and additions on the property. | Land | Improvement |
|---|---|---|---|---|
| 2025 | $10,606 | $915,900 | $302,600 | $613,300 |
| 2024 | $9,411 | $863,400 | $241,500 | $621,900 |
| 2023 | $8,746 | $814,300 | $227,800 | $586,500 |
| 2022 | $8,054 | $740,300 | $207,100 | $533,200 |
| 2021 | $7,478 | $700,800 | $199,100 | $501,700 |
| 2020 | $6,475 | $613,200 | $180,700 | $432,500 |
| 2019 | $5,566 | $528,100 | $158,500 | $369,600 |
| 2018 | $5,187 | $494,900 | $158,500 | $336,400 |
| 2017 | $5,187 | $489,800 | $158,500 | $331,300 |
| 2016 | $5,036 | $457,800 | $158,500 | $299,300 |
| 2015 | $5,206 | $429,900 | $164,400 | $265,500 |
| 2014 | $5,101 | $405,500 | $164,400 | $241,100 |
Source: Public Records
Map
Nearby Homes
- 72 Redlands Rd
- 104 Greaton Rd
- 37 Hastings St Unit 201
- 72-74 Manthorne Rd Unit 74
- 55 Redlands Rd
- 17 Hastings St Unit 5
- 96 Theodore Parker Rd
- 32 Russett Rd
- 1721 Centre St Unit 402
- 40 Newfield St
- 73 Dent St Unit 2
- 24 Rhoda St
- 23 Atlantis St
- 76 Lasell St
- 170 Bonad Rd
- 25 Clearwater Rd
- 205 Park St Unit 2
- 4 Anawan Ave Unit 7
- 68 Carroll St
- 183 Temple St
- 112 Maple St
- 8 Midvale Rd
- 122 Maple St
- 104 Maple St
- 119 Maple St
- 111 Maple St
- 126 Maple St
- 18 Hodgdon Terrace
- 18 Hodgdon Terrace
- 79 Midvale Rd Unit 2
- 79 Midvale Rd Unit 1
- 6 Sunnybank Rd
- 7 Sunnybank Rd
- 96 Maple St
- 16 Midvale Rd
- 134 Maple St Unit 134R
- 10 Sunnybank Rd
- 125 Maple St
- 107R Maple St
- 9 Hodgdon Terrace
Your Personal Tour Guide
Ask me questions while you tour the home.