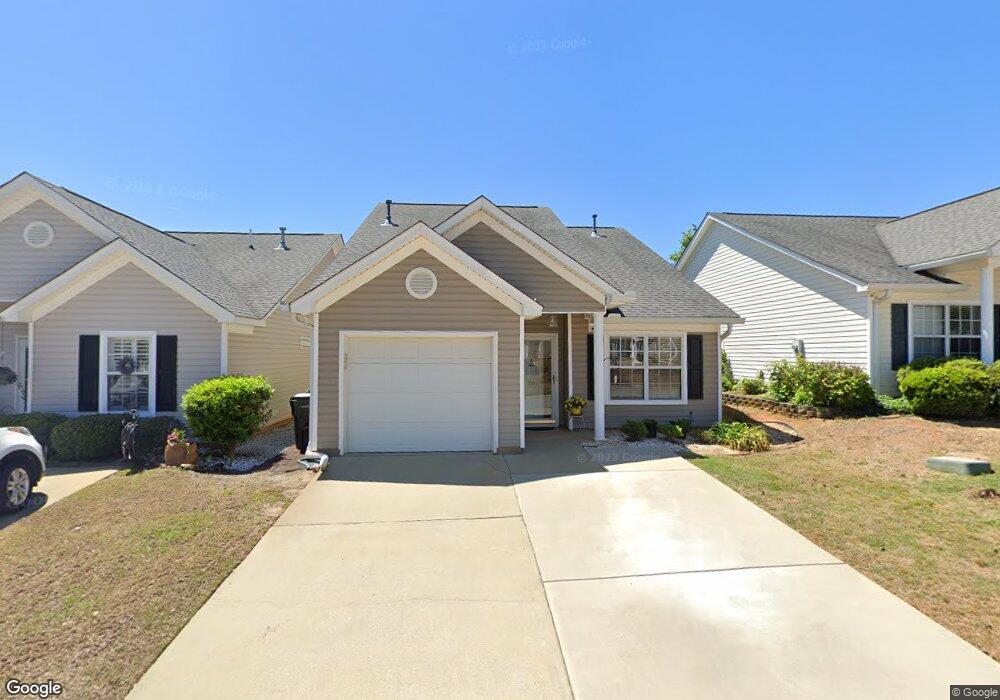
116 Merowey Ct Chapin, SC 29036
Estimated Value: $210,000 - $250,000
3
Beds
2
Baths
1,374
Sq Ft
$168/Sq Ft
Est. Value
About This Home
This home is located at 116 Merowey Ct, Chapin, SC 29036 and is currently estimated at $230,335, approximately $167 per square foot. 116 Merowey Ct is a home located in Lexington County with nearby schools including Chapin Elementary School, Chapin Intermediate, and Chapin High School.
Ownership History
Date
Name
Owned For
Owner Type
Purchase Details
Closed on
Apr 30, 2024
Sold by
Meyer Marcella
Bought by
Church Tammy S
Current Estimated Value
Home Financials for this Owner
Home Financials are based on the most recent Mortgage that was taken out on this home.
Original Mortgage
$202,500
Outstanding Balance
$199,584
Interest Rate
6.74%
Mortgage Type
New Conventional
Estimated Equity
$30,751
Purchase Details
Closed on
Nov 26, 2018
Sold by
Harbin Susan B
Bought by
Meyer Marcella
Home Financials for this Owner
Home Financials are based on the most recent Mortgage that was taken out on this home.
Original Mortgage
$134,345
Interest Rate
4.9%
Mortgage Type
New Conventional
Purchase Details
Closed on
Sep 10, 2004
Sold by
Fairhaven Llc
Bought by
Harbin William S and Harbin Susan B
Create a Home Valuation Report for This Property
The Home Valuation Report is an in-depth analysis detailing your home's value as well as a comparison with similar homes in the area
Home Values in the Area
Average Home Value in this Area
Purchase History
| Date | Buyer | Sale Price | Title Company |
|---|---|---|---|
| Church Tammy S | $225,000 | South Carolina Title | |
| Meyer Marcella | $138,500 | None Available | |
| Harbin William S | $108,500 | -- |
Source: Public Records
Mortgage History
| Date | Status | Borrower | Loan Amount |
|---|---|---|---|
| Open | Church Tammy S | $202,500 | |
| Previous Owner | Meyer Marcella | $134,345 |
Source: Public Records
Tax History Compared to Growth
Tax History
| Year | Tax Paid | Tax Assessment Tax Assessment Total Assessment is a certain percentage of the fair market value that is determined by local assessors to be the total taxable value of land and additions on the property. | Land | Improvement |
|---|---|---|---|---|
| 2024 | $1,037 | $5,294 | $700 | $4,594 |
| 2023 | $473 | $5,294 | $700 | $4,594 |
| 2022 | $478 | $5,294 | $700 | $4,594 |
| 2020 | $924 | $5,294 | $700 | $4,594 |
| 2019 | $933 | $5,260 | $700 | $4,560 |
| 2018 | $289 | $4,273 | $700 | $3,573 |
| 2017 | $275 | $4,273 | $700 | $3,573 |
| 2016 | $290 | $4,272 | $700 | $3,572 |
| 2014 | $297 | $4,301 | $460 | $3,841 |
| 2013 | -- | $4,300 | $460 | $3,840 |
Source: Public Records
Map
Nearby Homes
- 129 Merowey Ct
- 100 Recluse St
- 213 Firebridge Ct
- 428 Firebridge Dr
- 1679 Amicks Ferry Rd
- 542 Griffon Dr
- 550 Griffon Dr
- 558 Griffon Dr
- 562 Griffon Dr
- 566 Griffon Dr
- 570 Griffon Dr
- 574 Griffon Dr
- 538 Griffon Dr
- 551 Griffon Dr
- 555 Griffon Dr
- 559 Griffon Dr
- 547 Griffon Dr
- 563 Griffon Dr
- 567 Griffon Dr
- 571 Griffon Dr