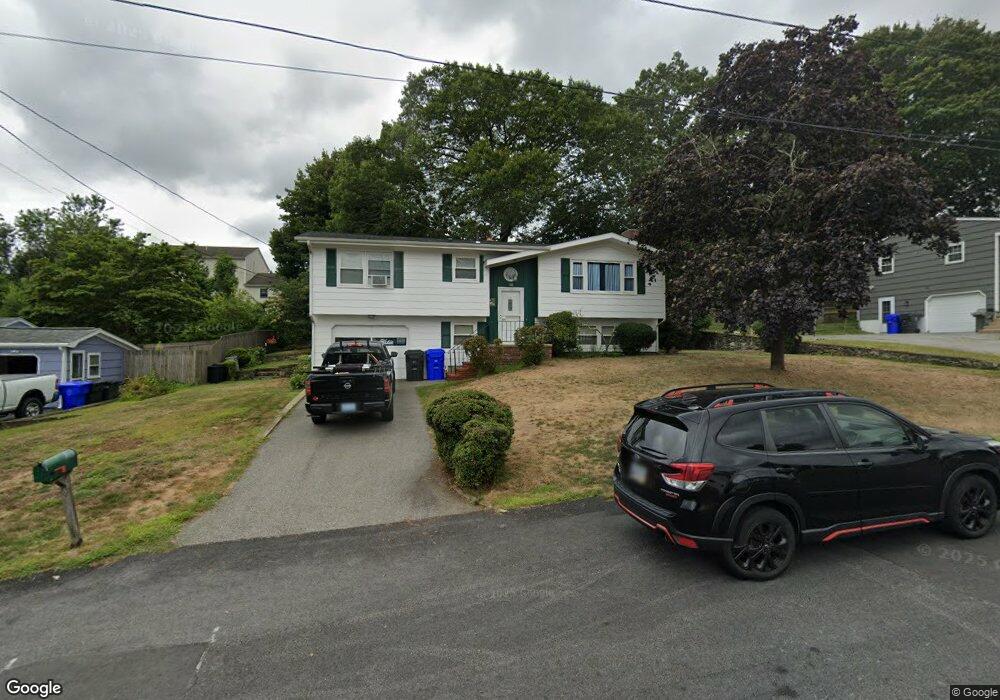
116 Monterey Dr West Warwick, RI 02893
Crompton NeighborhoodEstimated Value: $416,481 - $469,000
3
Beds
3
Baths
1,220
Sq Ft
$368/Sq Ft
Est. Value
About This Home
This home is located at 116 Monterey Dr, West Warwick, RI 02893 and is currently estimated at $449,120, approximately $368 per square foot. 116 Monterey Dr is a home located in Kent County with nearby schools including West Warwick High School.
Ownership History
Date
Name
Owned For
Owner Type
Purchase Details
Closed on
May 10, 2019
Sold by
Houde Thomas J and Houde Janet S
Bought by
Houde Thomas J and Houde Janet S
Current Estimated Value
Purchase Details
Closed on
Apr 23, 1993
Sold by
Robertson Ronald H
Bought by
Houde Thomas J and Hopkins Janet S
Home Financials for this Owner
Home Financials are based on the most recent Mortgage that was taken out on this home.
Original Mortgage
$94,800
Interest Rate
7.45%
Create a Home Valuation Report for This Property
The Home Valuation Report is an in-depth analysis detailing your home's value as well as a comparison with similar homes in the area
Home Values in the Area
Average Home Value in this Area
Purchase History
| Date | Buyer | Sale Price | Title Company |
|---|---|---|---|
| Houde Thomas J | -- | -- | |
| Houde Thomas J | $118,500 | -- |
Source: Public Records
Mortgage History
| Date | Status | Borrower | Loan Amount |
|---|---|---|---|
| Previous Owner | Houde Thomas J | $18,575 | |
| Previous Owner | Houde Thomas J | $94,800 |
Source: Public Records
Tax History
| Year | Tax Paid | Tax Assessment Tax Assessment Total Assessment is a certain percentage of the fair market value that is determined by local assessors to be the total taxable value of land and additions on the property. | Land | Improvement |
|---|---|---|---|---|
| 2025 | $5,573 | $390,000 | $109,500 | $280,500 |
| 2024 | $5,560 | $297,500 | $86,500 | $211,000 |
| 2023 | $5,450 | $297,500 | $86,500 | $211,000 |
| 2022 | $5,367 | $297,500 | $86,500 | $211,000 |
| 2021 | $5,382 | $234,000 | $69,200 | $164,800 |
| 2020 | $5,382 | $234,000 | $69,200 | $164,800 |
| 2019 | $6,861 | $234,000 | $69,200 | $164,800 |
| 2018 | $4,580 | $168,500 | $67,200 | $101,300 |
| 2017 | $4,433 | $168,500 | $67,200 | $101,300 |
| 2016 | $4,354 | $168,500 | $67,200 | $101,300 |
| 2015 | $4,120 | $158,700 | $67,200 | $91,500 |
| 2014 | $4,029 | $158,700 | $67,200 | $91,500 |
Source: Public Records
Map
Nearby Homes
- 52 Kristee Cir Unit 52
- 565 Quaker Ln Unit 32
- 35 Shady Hill Dr
- 240 Coit Ave
- 2 Fairgreen Dr
- 650 E Greenwich Ave Unit 5211
- 650 E Greenwich Ave Unit 3102
- 650 E Greenwich Ave Unit 5-110
- 650 E Greenwich Ave Unit 7-207
- 165 Lockwood St
- 500 E Greenwich Ave Unit 124
- 752 Quaker Ln Unit A 314
- 752 Quaker Ln Unit A201
- 57 Setian Ln
- 180 Spencer Woods Dr
- 6 Teresa Ann Crossing
- 8 Teresa Ann Crossing
- 4 Teresa Ann Crossing
- 2 Teresa Ann Crossing
- 36 Cowesett Ave Unit 5
Your Personal Tour Guide
Ask me questions while you tour the home.