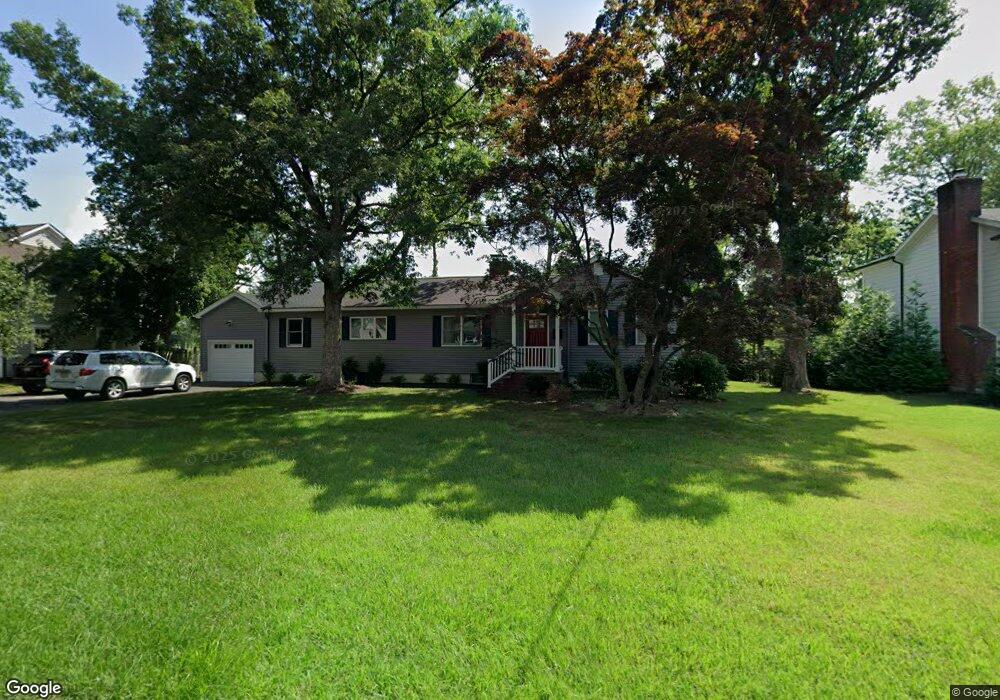
116 Morton Dr Ramsey, NJ 07446
Estimated Value: $875,328 - $971,000
--
Bed
--
Bath
2,096
Sq Ft
$445/Sq Ft
Est. Value
About This Home
This home is located at 116 Morton Dr, Ramsey, NJ 07446 and is currently estimated at $933,582, approximately $445 per square foot. 116 Morton Dr is a home located in Bergen County with nearby schools including Ramsey High School and Young World Day School.
Ownership History
Date
Name
Owned For
Owner Type
Purchase Details
Closed on
Apr 20, 2000
Sold by
Burt James
Bought by
Sweeney Annette O
Current Estimated Value
Home Financials for this Owner
Home Financials are based on the most recent Mortgage that was taken out on this home.
Original Mortgage
$230,000
Outstanding Balance
$78,797
Interest Rate
8.23%
Estimated Equity
$854,785
Purchase Details
Closed on
Jun 28, 1999
Sold by
Olsen Clinton D and Olsen Eleanor L
Bought by
Burt James and Burt Colleen
Create a Home Valuation Report for This Property
The Home Valuation Report is an in-depth analysis detailing your home's value as well as a comparison with similar homes in the area
Home Values in the Area
Average Home Value in this Area
Purchase History
| Date | Buyer | Sale Price | Title Company |
|---|---|---|---|
| Sweeney Annette O | $422,500 | -- | |
| Burt James | $400,000 | -- |
Source: Public Records
Mortgage History
| Date | Status | Borrower | Loan Amount |
|---|---|---|---|
| Open | Sweeney Annette O | $230,000 |
Source: Public Records
Tax History Compared to Growth
Tax History
| Year | Tax Paid | Tax Assessment Tax Assessment Total Assessment is a certain percentage of the fair market value that is determined by local assessors to be the total taxable value of land and additions on the property. | Land | Improvement |
|---|---|---|---|---|
| 2025 | $15,230 | $825,500 | $417,800 | $407,700 |
| 2024 | $14,772 | $539,700 | $310,600 | $229,100 |
| 2023 | $14,156 | $539,700 | $310,600 | $229,100 |
| 2022 | $14,156 | $539,700 | $310,600 | $229,100 |
| 2021 | $13,994 | $539,700 | $310,600 | $229,100 |
| 2020 | $13,870 | $539,700 | $310,600 | $229,100 |
| 2019 | $13,266 | $539,700 | $310,600 | $229,100 |
| 2018 | $12,937 | $539,700 | $310,600 | $229,100 |
| 2017 | $12,694 | $539,700 | $310,600 | $229,100 |
| 2016 | $12,343 | $539,700 | $310,600 | $229,100 |
| 2015 | $12,965 | $480,000 | $337,000 | $143,000 |
| 2014 | $12,744 | $480,000 | $337,000 | $143,000 |
Source: Public Records
Map
Nearby Homes