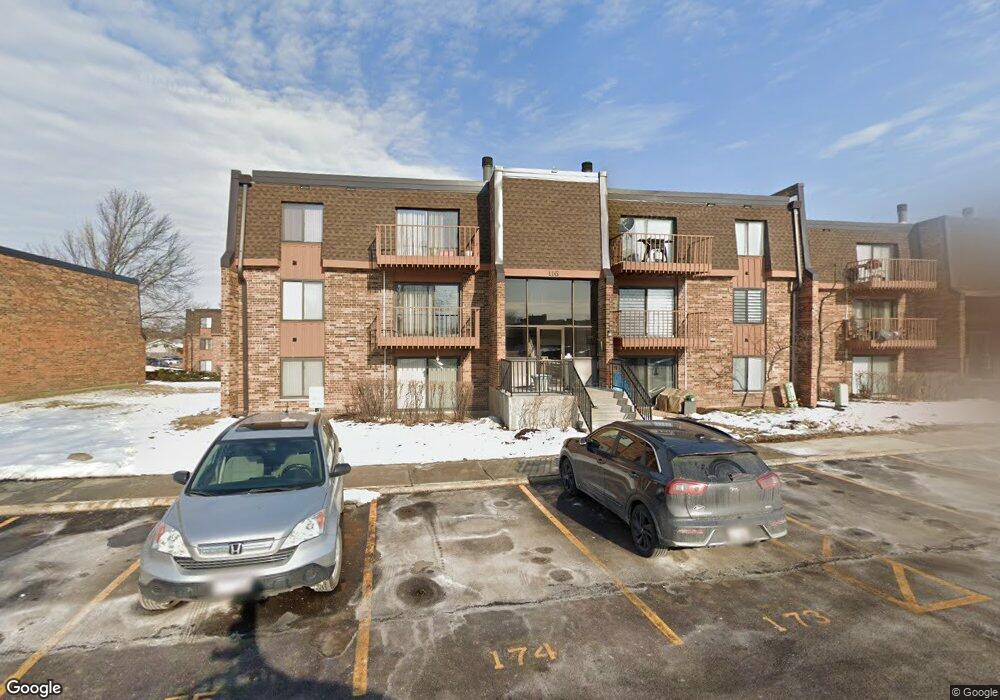
116 Mullingar Ct Unit 1161B Schaumburg, IL 60193
South Schaumburg NeighborhoodEstimated Value: $166,000 - $184,000
1
Bed
--
Bath
825
Sq Ft
$216/Sq Ft
Est. Value
About This Home
This home is located at 116 Mullingar Ct Unit 1161B, Schaumburg, IL 60193 and is currently estimated at $178,018, approximately $215 per square foot. 116 Mullingar Ct Unit 1161B is a home located in Cook County with nearby schools including Edwin Aldrin Elementary School, Robert Frost Junior High School, and Schaumburg High School.
Ownership History
Date
Name
Owned For
Owner Type
Purchase Details
Closed on
Jul 29, 1999
Sold by
Whalen Peter M
Bought by
Obrochta Bronislawa
Current Estimated Value
Home Financials for this Owner
Home Financials are based on the most recent Mortgage that was taken out on this home.
Original Mortgage
$66,560
Outstanding Balance
$19,172
Interest Rate
7.68%
Mortgage Type
FHA
Estimated Equity
$158,846
Purchase Details
Closed on
Sep 27, 1996
Sold by
Lord Daniel and Lord Sharon L
Bought by
Whalen Peter M
Home Financials for this Owner
Home Financials are based on the most recent Mortgage that was taken out on this home.
Original Mortgage
$60,500
Interest Rate
8.14%
Mortgage Type
FHA
Purchase Details
Closed on
Dec 11, 1995
Sold by
Hud
Bought by
Lord Daniel F and Lord Sharon L
Home Financials for this Owner
Home Financials are based on the most recent Mortgage that was taken out on this home.
Original Mortgage
$36,800
Interest Rate
7.24%
Create a Home Valuation Report for This Property
The Home Valuation Report is an in-depth analysis detailing your home's value as well as a comparison with similar homes in the area
Home Values in the Area
Average Home Value in this Area
Purchase History
| Date | Buyer | Sale Price | Title Company |
|---|---|---|---|
| Obrochta Bronislawa | $68,500 | -- | |
| Whalen Peter M | $62,000 | -- | |
| Lord Daniel F | -- | Attorneys Title Guaranty Fun |
Source: Public Records
Mortgage History
| Date | Status | Borrower | Loan Amount |
|---|---|---|---|
| Open | Obrochta Bronislawa | $66,560 | |
| Previous Owner | Whalen Peter M | $60,500 | |
| Previous Owner | Lord Daniel F | $36,800 |
Source: Public Records
Tax History Compared to Growth
Tax History
| Year | Tax Paid | Tax Assessment Tax Assessment Total Assessment is a certain percentage of the fair market value that is determined by local assessors to be the total taxable value of land and additions on the property. | Land | Improvement |
|---|---|---|---|---|
| 2024 | $2,270 | $11,421 | $1,776 | $9,645 |
| 2023 | $2,173 | $11,421 | $1,776 | $9,645 |
| 2022 | $2,173 | $11,421 | $1,776 | $9,645 |
| 2021 | $1,836 | $9,388 | $1,204 | $8,184 |
| 2020 | $1,872 | $9,388 | $1,204 | $8,184 |
| 2019 | $1,897 | $10,506 | $1,204 | $9,302 |
| 2018 | $993 | $6,745 | $1,078 | $5,667 |
| 2017 | $995 | $6,745 | $1,078 | $5,667 |
| 2016 | $1,173 | $6,745 | $1,078 | $5,667 |
| 2015 | $1,148 | $6,462 | $951 | $5,511 |
| 2014 | $1,152 | $6,462 | $951 | $5,511 |
| 2013 | $1,105 | $6,462 | $951 | $5,511 |
Source: Public Records
Map
Nearby Homes
- 631 Derry Ct Unit 3C
- 711 Tipperary Ct Unit 2D
- 712 Tipperary Ct Unit 1C
- 620 Tralee Ct Unit 3A
- 620 Tralee Ct Unit 3B
- 727 Killarney Ct Unit 1C
- 635 Limerick Ln Unit 2B
- 722 Tipperary Ct Unit 3D
- 733 Limerick Ln Unit 7333D
- 614 Tralee Ct Unit 2-C
- 553 Stone Gate Cir
- 712 Dante Ct
- 36 Shore Dr
- 300 S Roselle Rd Unit 419
- 300 S Roselle Rd Unit 519
- 300 S Roselle Rd Unit 116
- 300 S Roselle Rd Unit 207
- 126 Manchester Ct Unit 61B
- 916 Manchester Cir Unit 91A
- 415 Laconia Ln
- 116 Mullingar Ct Unit 3B
- 108 Mullingar Ct Unit 1C
- 116 Mullingar Ct Unit 1163D
- 116 Mullingar Ct Unit 1162B
- 116 Mullingar Ct Unit 1161D
- 108 Mullingar Ct Unit 1082D
- 108 Mullingar Ct Unit 1082B
- 108 Mullingar Ct Unit 1082A
- 116 Mullingar Ct Unit 1161C
- 116 Mullingar Ct Unit 1163C
- 116 Mullingar Ct Unit 1162C
- 108 Mullingar Ct Unit 1081D
- 116 Mullingar Ct Unit 1163B
- 116 Mullingar Ct Unit 1162A
- 108 Mullingar Ct Unit 1081A
- 108 Mullingar Ct Unit 1081B
- 116 Mullingar Ct Unit 1161A
- 108 Mullingar Ct Unit 1081C
- 108 Mullingar Ct Unit 1082C
- 116 Mullingar Ct Unit 1163A