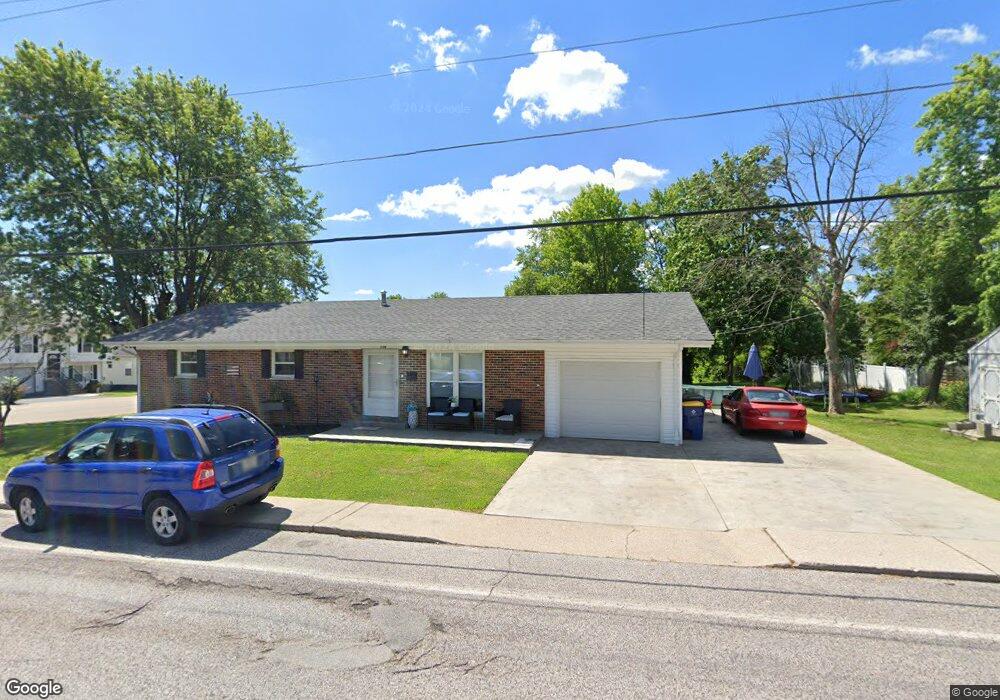
116 N 9th St Festus, MO 63028
Festus/Crystal City NeighborhoodEstimated Value: $166,000 - $208,000
3
Beds
1
Bath
1,196
Sq Ft
$164/Sq Ft
Est. Value
About This Home
This home is located at 116 N 9th St, Festus, MO 63028 and is currently estimated at $196,490, approximately $164 per square foot. 116 N 9th St is a home located in Jefferson County with nearby schools including Festus Elementary School, Festus Intermediate School, and Festus Middle School.
Ownership History
Date
Name
Owned For
Owner Type
Purchase Details
Closed on
May 15, 2014
Sold by
Hamby Vickie R and Kiepert Dana M
Bought by
Mercer Llc
Current Estimated Value
Home Financials for this Owner
Home Financials are based on the most recent Mortgage that was taken out on this home.
Original Mortgage
$51,900
Outstanding Balance
$39,745
Interest Rate
4.46%
Mortgage Type
Future Advance Clause Open End Mortgage
Estimated Equity
$156,745
Purchase Details
Closed on
Aug 26, 2011
Sold by
Steiger Adrian and Steiger Wanda
Bought by
Hamby Vickie R and Kiepert Dana M
Purchase Details
Closed on
Jan 19, 2010
Sold by
Steiger Adrian A and Steiger Wanda M
Bought by
Steiger Adrian A and Steiger Wanda M
Create a Home Valuation Report for This Property
The Home Valuation Report is an in-depth analysis detailing your home's value as well as a comparison with similar homes in the area
Home Values in the Area
Average Home Value in this Area
Purchase History
| Date | Buyer | Sale Price | Title Company |
|---|---|---|---|
| Mercer Llc | -- | Title Partners Agency Llc | |
| Hamby Vickie R | -- | None Available | |
| Steiger Adrian A | -- | None Available | |
| Steiger Adrian A | -- | None Available |
Source: Public Records
Mortgage History
| Date | Status | Borrower | Loan Amount |
|---|---|---|---|
| Open | Mercer Llc | $51,900 |
Source: Public Records
Tax History
| Year | Tax Paid | Tax Assessment Tax Assessment Total Assessment is a certain percentage of the fair market value that is determined by local assessors to be the total taxable value of land and additions on the property. | Land | Improvement |
|---|---|---|---|---|
| 2025 | $962 | $18,400 | $1,500 | $16,900 |
| 2024 | $962 | $17,000 | $1,500 | $15,500 |
| 2023 | $962 | $16,400 | $1,500 | $14,900 |
| 2022 | $924 | $16,400 | $1,500 | $14,900 |
| 2021 | $924 | $16,400 | $1,500 | $14,900 |
| 2020 | $878 | $14,600 | $1,200 | $13,400 |
| 2019 | $877 | $14,600 | $1,200 | $13,400 |
| 2018 | $791 | $14,600 | $1,200 | $13,400 |
| 2016 | $730 | $13,400 | $1,300 | $12,100 |
Source: Public Records
Map
Nearby Homes
- 115 N 9th St
- 129 N 9th St
- 1016 Ann St
- 601 Warne St
- 617 N 6th St
- 725 Woodrow Ave
- 416 Russell Ave
- 807 Huber St
- 122 Northview Dr
- 1824 Oak Dr
- 1648 Flagstaff Dr
- 1107 Burgess Ave
- 1001 Parc Central Dr
- 912 Parc Central Dr
- 328 N 2nd St
- 105 Ozark Dr
- 119 Riverport Dr
- 403 Harry Truman Ct
- 309 Jefferson Ave
- 113 Parkview Dr
Your Personal Tour Guide
Ask me questions while you tour the home.