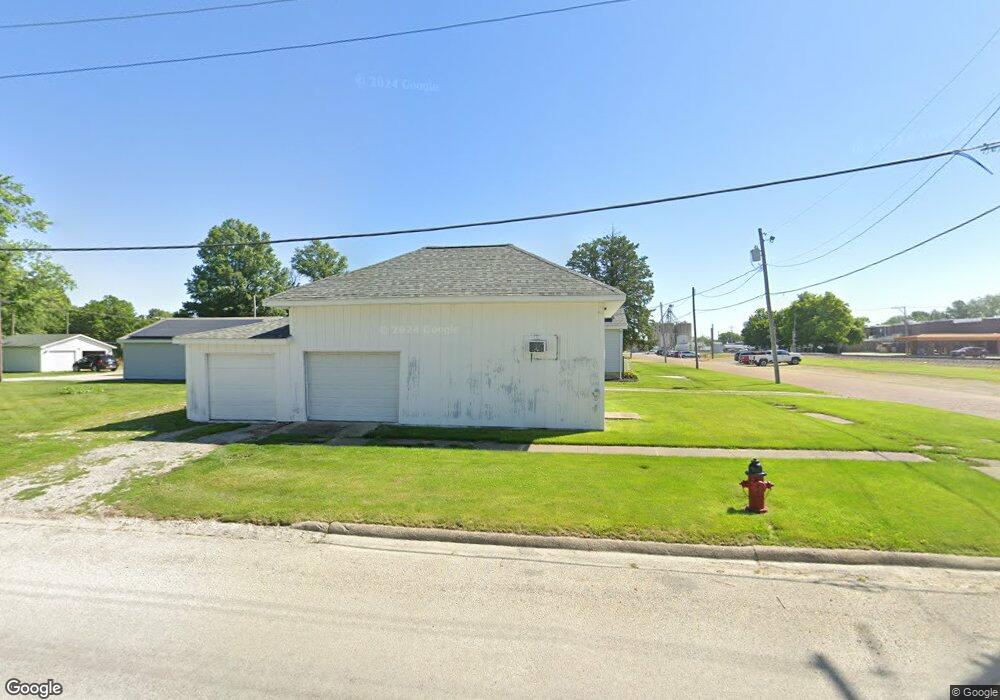
116 N Cedar St Nokomis, IL 62075
Estimated Value: $51,871 - $78,000
2
Beds
1
Bath
836
Sq Ft
$79/Sq Ft
Est. Value
About This Home
This home is located at 116 N Cedar St, Nokomis, IL 62075 and is currently estimated at $66,218, approximately $79 per square foot. 116 N Cedar St is a home located in Montgomery County with nearby schools including North Elementary School, Nokomis Junior/Senior High School, and St. Louis Catholic School.
Ownership History
Date
Name
Owned For
Owner Type
Purchase Details
Closed on
Aug 1, 2013
Sold by
Boomgarden Daniel J
Bought by
Beaman Robert and Beaman Martha
Current Estimated Value
Purchase Details
Closed on
Nov 24, 2009
Sold by
House Dixie Ruth and Rudniski Ronald
Bought by
Boomgarden Daniel J
Home Financials for this Owner
Home Financials are based on the most recent Mortgage that was taken out on this home.
Original Mortgage
$40,800
Interest Rate
4.9%
Mortgage Type
New Conventional
Create a Home Valuation Report for This Property
The Home Valuation Report is an in-depth analysis detailing your home's value as well as a comparison with similar homes in the area
Home Values in the Area
Average Home Value in this Area
Purchase History
| Date | Buyer | Sale Price | Title Company |
|---|---|---|---|
| Beaman Robert | $38,000 | -- | |
| Boomgarden Daniel J | $40,000 | None Available |
Source: Public Records
Mortgage History
| Date | Status | Borrower | Loan Amount |
|---|---|---|---|
| Previous Owner | Boomgarden Daniel J | $40,800 |
Source: Public Records
Tax History Compared to Growth
Tax History
| Year | Tax Paid | Tax Assessment Tax Assessment Total Assessment is a certain percentage of the fair market value that is determined by local assessors to be the total taxable value of land and additions on the property. | Land | Improvement |
|---|---|---|---|---|
| 2024 | $948 | $16,900 | $6,780 | $10,120 |
| 2023 | $865 | $15,850 | $6,360 | $9,490 |
| 2022 | $828 | $15,230 | $6,110 | $9,120 |
| 2021 | $876 | $15,910 | $6,380 | $9,530 |
| 2020 | $817 | $15,180 | $6,090 | $9,090 |
| 2019 | $887 | $16,030 | $6,430 | $9,600 |
| 2018 | $1,378 | $15,090 | $6,050 | $9,040 |
| 2017 | $1,344 | $14,190 | $5,690 | $8,500 |
| 2016 | $1,346 | $13,800 | $5,530 | $8,270 |
| 2015 | $1,309 | $13,370 | $5,360 | $8,010 |
| 2013 | $783 | $14,290 | $5,430 | $8,860 |
Source: Public Records
Map
Nearby Homes