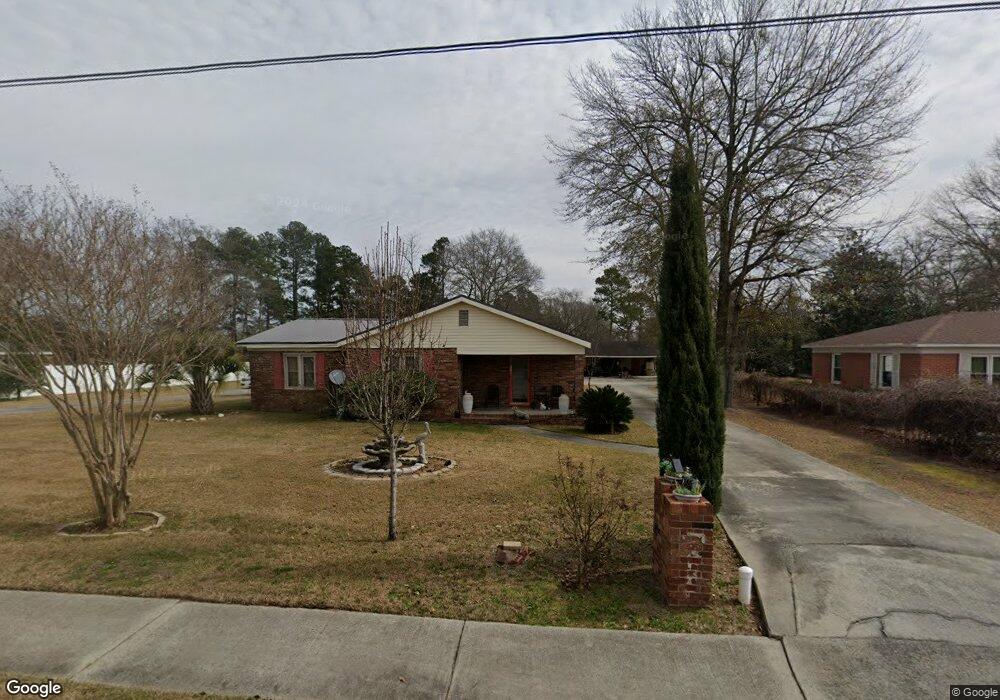
116 N Foss St Statesboro, GA 30458
Estimated Value: $220,000 - $313,000
4
Beds
2
Baths
2,970
Sq Ft
$92/Sq Ft
Est. Value
About This Home
This home is located at 116 N Foss St, Statesboro, GA 30458 and is currently estimated at $272,960, approximately $91 per square foot. 116 N Foss St is a home located in Bulloch County with nearby schools including Julia P. Bryant Elementary School, Statesboro High School, and William James Middle School.
Ownership History
Date
Name
Owned For
Owner Type
Purchase Details
Closed on
May 30, 2016
Sold by
Black Princess L
Bought by
Knight V Bessie
Current Estimated Value
Purchase Details
Closed on
Oct 19, 2015
Sold by
Venson Bessie
Bought by
Black Princess L
Purchase Details
Closed on
Jun 4, 2013
Sold by
Venson Bessie
Bought by
Black Princess L
Purchase Details
Closed on
Apr 1, 1999
Bought by
Venson Bessie
Purchase Details
Closed on
Aug 1, 1995
Bought by
Venson Bessie
Create a Home Valuation Report for This Property
The Home Valuation Report is an in-depth analysis detailing your home's value as well as a comparison with similar homes in the area
Home Values in the Area
Average Home Value in this Area
Purchase History
| Date | Buyer | Sale Price | Title Company |
|---|---|---|---|
| Knight V Bessie | -- | -- | |
| Black Princess L | -- | -- | |
| Black Princess L | -- | -- | |
| Venson Bessie | -- | -- | |
| Venson Bessie | -- | -- |
Source: Public Records
Tax History Compared to Growth
Tax History
| Year | Tax Paid | Tax Assessment Tax Assessment Total Assessment is a certain percentage of the fair market value that is determined by local assessors to be the total taxable value of land and additions on the property. | Land | Improvement |
|---|---|---|---|---|
| 2024 | $2,091 | $76,280 | $5,040 | $71,240 |
| 2023 | $1,505 | $70,560 | $5,040 | $65,520 |
| 2022 | $1,214 | $61,919 | $5,040 | $56,879 |
| 2021 | $1,082 | $53,646 | $5,040 | $48,606 |
| 2020 | $1,060 | $51,065 | $5,040 | $46,025 |
| 2019 | $1,075 | $51,492 | $5,040 | $46,452 |
| 2018 | $983 | $45,144 | $5,040 | $40,104 |
| 2017 | $951 | $43,184 | $5,040 | $38,144 |
| 2016 | $940 | $41,617 | $5,040 | $36,577 |
| 2015 | $871 | $40,372 | $5,040 | $35,332 |
| 2014 | $801 | $40,372 | $5,040 | $35,332 |
Source: Public Records
Map
Nearby Homes
- 103 Floyd St
- 460 Martin Luther King jr Dr
- LOT 3 Pulaski Rd
- LOT 2 Pulaski Rd
- 141 Williams Rd
- 118 Roundtree St
- 0 Pulaski Rd Unit 325524
- 0 Pulaski Rd Unit 10385082
- Denmark Plan at Stockyard
- Norman TH Plan at Stockyard
- Davis Plan at Stockyard
- Aria Plan at Stockyard
- Darwin Plan at Stockyard
- Hayden Plan at Stockyard
- Cali Plan at Stockyard
- Belhaven Plan at Stockyard
- 228 Johnson St
- LOT 22 Oak Hill Dr
- 113 Church St
- 5129 Georgia 67