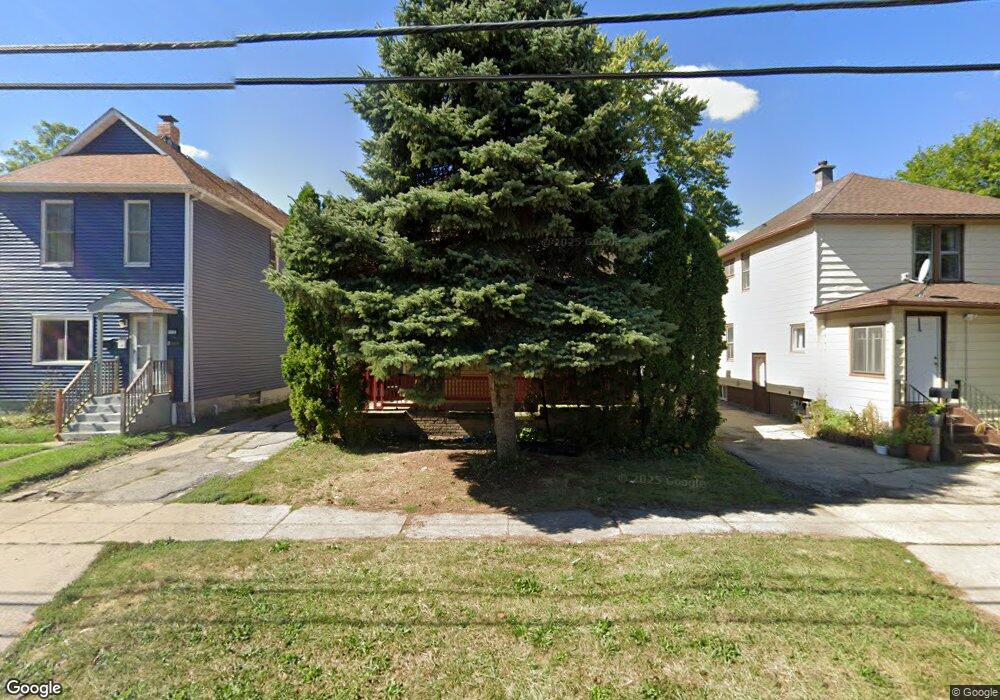
116 N Jackson St Waukegan, IL 60085
Lyon Grove NeighborhoodEstimated Value: $194,000 - $233,000
3
Beds
2
Baths
1,879
Sq Ft
$112/Sq Ft
Est. Value
About This Home
This home is located at 116 N Jackson St, Waukegan, IL 60085 and is currently estimated at $211,345, approximately $112 per square foot. 116 N Jackson St is a home located in Lake County with nearby schools including H R McCall Elementary School, Miguel Juarez Middle School, and Waukegan High School.
Ownership History
Date
Name
Owned For
Owner Type
Purchase Details
Closed on
Oct 7, 2004
Sold by
Mercado Eva
Bought by
Ortiz Jay and Ortiz Sylvia
Current Estimated Value
Home Financials for this Owner
Home Financials are based on the most recent Mortgage that was taken out on this home.
Original Mortgage
$83,500
Outstanding Balance
$41,575
Interest Rate
5.85%
Mortgage Type
Commercial
Estimated Equity
$169,770
Purchase Details
Closed on
Oct 31, 2003
Sold by
Lopez Angel
Bought by
Mercado Eva
Purchase Details
Closed on
Mar 28, 1994
Sold by
Baker Lottie
Bought by
Lopez Angel L and Mercado Eva
Home Financials for this Owner
Home Financials are based on the most recent Mortgage that was taken out on this home.
Original Mortgage
$71,276
Interest Rate
7.17%
Mortgage Type
FHA
Purchase Details
Closed on
Feb 17, 1994
Sold by
Mercado David
Bought by
Baker Lotte
Home Financials for this Owner
Home Financials are based on the most recent Mortgage that was taken out on this home.
Original Mortgage
$71,276
Interest Rate
7.17%
Mortgage Type
FHA
Create a Home Valuation Report for This Property
The Home Valuation Report is an in-depth analysis detailing your home's value as well as a comparison with similar homes in the area
Home Values in the Area
Average Home Value in this Area
Purchase History
| Date | Buyer | Sale Price | Title Company |
|---|---|---|---|
| Ortiz Jay | $105,000 | Ticor | |
| Mercado Eva | -- | -- | |
| Lopez Angel L | $48,000 | -- | |
| Baker Lotte | -- | -- |
Source: Public Records
Mortgage History
| Date | Status | Borrower | Loan Amount |
|---|---|---|---|
| Open | Ortiz Jay | $83,500 | |
| Previous Owner | Lopez Angel L | $71,276 |
Source: Public Records
Tax History Compared to Growth
Tax History
| Year | Tax Paid | Tax Assessment Tax Assessment Total Assessment is a certain percentage of the fair market value that is determined by local assessors to be the total taxable value of land and additions on the property. | Land | Improvement |
|---|---|---|---|---|
| 2024 | $4,147 | $50,513 | $7,517 | $42,996 |
| 2023 | $4,439 | $43,976 | $6,169 | $37,807 |
| 2022 | $4,439 | $45,405 | $5,337 | $40,068 |
| 2021 | $4,047 | $38,815 | $4,580 | $34,235 |
| 2020 | $4,099 | $36,161 | $4,267 | $31,894 |
| 2019 | $4,125 | $33,136 | $3,910 | $29,226 |
| 2018 | $3,078 | $23,805 | $4,426 | $19,379 |
| 2017 | $2,996 | $21,061 | $3,916 | $17,145 |
| 2016 | $2,828 | $18,301 | $3,403 | $14,898 |
| 2015 | $2,767 | $16,380 | $3,046 | $13,334 |
| 2014 | $3,383 | $21,502 | $3,068 | $18,434 |
| 2012 | $4,059 | $25,800 | $3,324 | $22,476 |
Source: Public Records
Map
Nearby Homes
- 23 N Jackson St
- 1416 Hamilton Ct
- 28 N Saint James St
- 613 Washington St
- 1521 Catalpa Ave
- 511 Chestnut St
- 428 N Poplar St
- 557 W Water St
- 610 Bluff St
- 522 N Poplar St
- 304 Powell Ave
- 215 S Park Ave
- 702 Franklin St
- 452 North Ave
- 620 N Poplar St
- 613 Clarke Ave
- 305 Besley Place
- 49 S Lewis Ave
- 408 Besley Place
- 222 Grand Ave
- 112 N Jackson St
- 118 N Jackson St
- 122 N Jackson St
- 110 N Jackson St
- 111 Edison Ct
- 126 N Jackson St
- 104 N Jackson St
- 128 N Jackson St
- 40 N Jackson St
- 113 N Jackson St
- 115 N Jackson St
- 132 N Jackson St
- 117 N Jackson St
- 105 N Jackson St
- 36 N Jackson St
- 101 N Jackson St
- 134 N Jackson St
- 123 N Jackson St
- 45 N Jackson St
- 131 N Jackson St