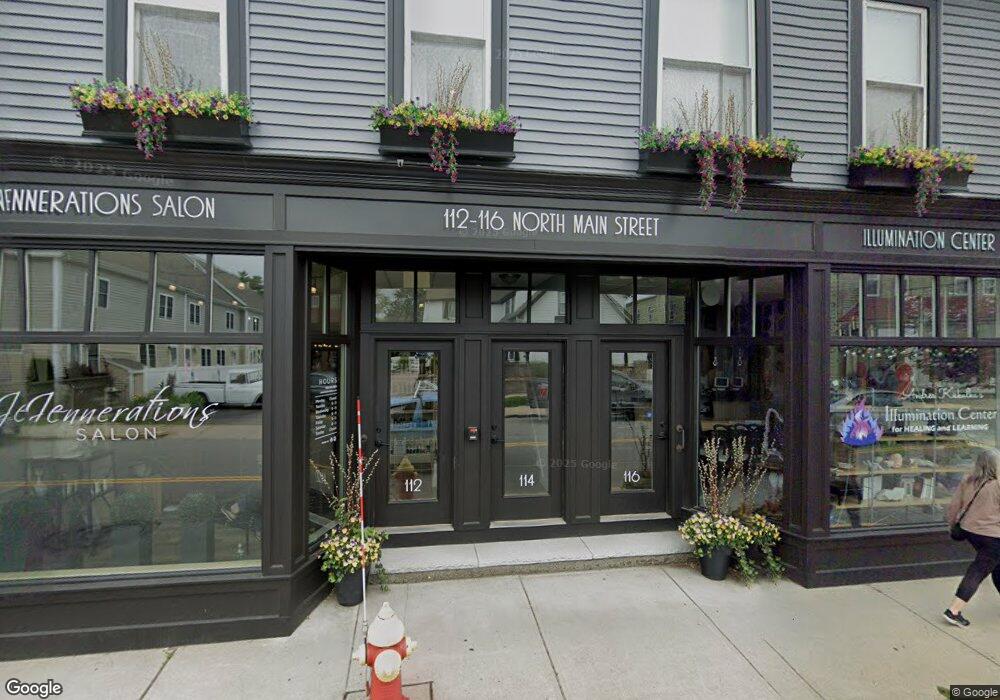
116 N Main St Unit 2 Mansfield, MA 02048
Estimated Value: $949,497 - $1,069,000
5
Beds
5
Baths
3,854
Sq Ft
$257/Sq Ft
Est. Value
About This Home
This home is located at 116 N Main St Unit 2, Mansfield, MA 02048 and is currently estimated at $989,124, approximately $256 per square foot. 116 N Main St Unit 2 is a home located in Bristol County with nearby schools including Everett W. Robinson Elementary School, Jordan/Jackson Elementary School, and Harold L. Qualters Middle School.
Ownership History
Date
Name
Owned For
Owner Type
Purchase Details
Closed on
Nov 19, 1993
Sold by
Cloherty Joseph E and Cloherty Barbara M
Bought by
Chadwick Edward F and Chadwick Linda M
Current Estimated Value
Create a Home Valuation Report for This Property
The Home Valuation Report is an in-depth analysis detailing your home's value as well as a comparison with similar homes in the area
Home Values in the Area
Average Home Value in this Area
Purchase History
| Date | Buyer | Sale Price | Title Company |
|---|---|---|---|
| Chadwick Edward F | $150,000 | -- | |
| Chadwick Edward F | $150,000 | -- |
Source: Public Records
Mortgage History
| Date | Status | Borrower | Loan Amount |
|---|---|---|---|
| Open | Chadwick Edward F | $196,400 | |
| Closed | Chadwick Edward F | $160,000 |
Source: Public Records
Tax History
| Year | Tax Paid | Tax Assessment Tax Assessment Total Assessment is a certain percentage of the fair market value that is determined by local assessors to be the total taxable value of land and additions on the property. | Land | Improvement |
|---|---|---|---|---|
| 2025 | $10,011 | $760,100 | $232,500 | $527,600 |
| 2024 | $9,195 | $681,100 | $232,500 | $448,600 |
| 2023 | $8,719 | $618,800 | $232,500 | $386,300 |
| 2022 | $8,615 | $567,900 | $215,200 | $352,700 |
| 2021 | $4,267 | $536,300 | $188,400 | $347,900 |
| 2020 | $7,400 | $481,800 | $179,400 | $302,400 |
| 2019 | $7,476 | $491,200 | $149,400 | $341,800 |
| 2018 | $7,110 | $469,100 | $142,400 | $326,700 |
| 2017 | $6,891 | $458,800 | $138,200 | $320,600 |
| 2016 | $6,454 | $418,800 | $131,600 | $287,200 |
| 2015 | $6,115 | $394,500 | $131,600 | $262,900 |
Source: Public Records
Map
Nearby Homes
- 28 Court St
- 266 N Main St Unit 3
- 150 Rumford Ave Unit 110
- 44 Fairfield Park Unit 44
- 22 Pleasant St Unit C
- 81 Chilson Ave
- 152 Central St
- 46 Hope St
- 166 Chauncy St
- 73-75 Draper Ave
- 619 N Main St
- 4 Concetta Cir
- 356 Central St
- 1 Deer Path Ln
- 460 Ware St
- 571 Ware St
- 14 Windchime Dr
- 4 Erick Rd Unit 90
- 261 East St
- 233 Central St
- 118 N Main St
- 110 N Main St Unit 110
- 110 N Main St
- 108 N Main St Unit 110
- 104 N Main St Unit 2F
- 104 N Main St Unit 2r
- 108 N Main St Unit 2nd floor
- 108 N Main St Unit 105
- 108 N Main St Unit R
- 106 N Main St
- 106 N Main St Unit 106
- 106 N Main St Unit 106 & 110
- 100 N Main St
- 112 N Main St Unit 116
- 114 N Main St Unit 2
- 114 N Main St
- 108-110 N Main St
- 94-102 N Main St
- 101 N Main St Unit A104
- 101 N Main St Unit A105
Your Personal Tour Guide
Ask me questions while you tour the home.