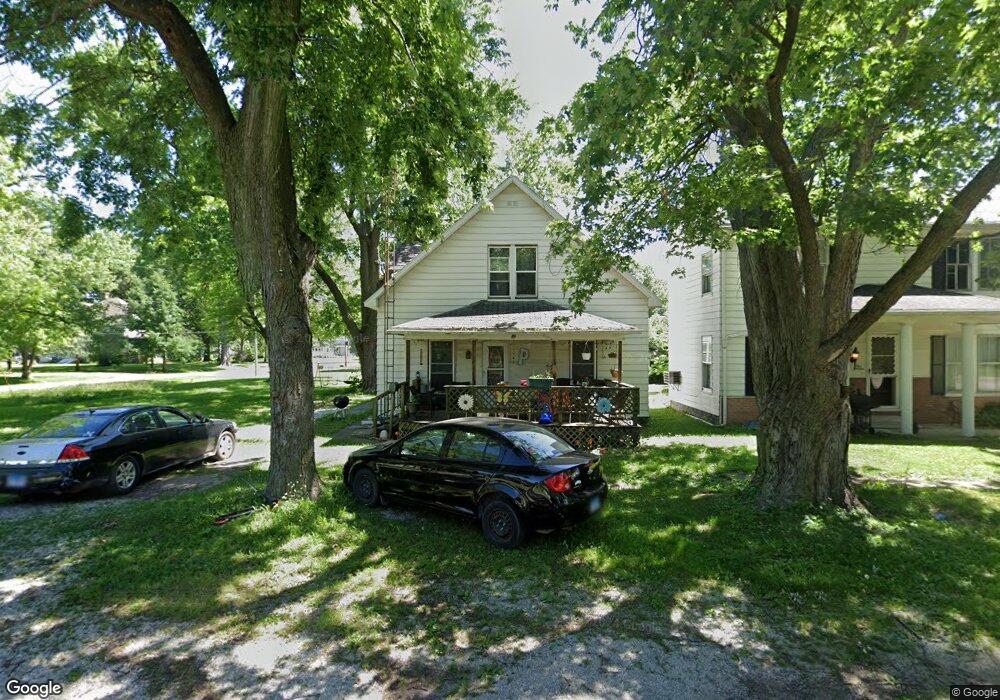
116 N Oak St Nokomis, IL 62075
Estimated Value: $42,000 - $74,000
4
Beds
1
Bath
1,310
Sq Ft
$40/Sq Ft
Est. Value
About This Home
This home is located at 116 N Oak St, Nokomis, IL 62075 and is currently estimated at $52,487, approximately $40 per square foot. 116 N Oak St is a home located in Montgomery County with nearby schools including North Elementary School, Nokomis Junior/Senior High School, and St. Louis Catholic School.
Ownership History
Date
Name
Owned For
Owner Type
Purchase Details
Closed on
Sep 15, 2022
Sold by
Morell Kenneth R and Morell Janeen L
Bought by
Peters Nathan
Current Estimated Value
Home Financials for this Owner
Home Financials are based on the most recent Mortgage that was taken out on this home.
Original Mortgage
$21,600
Outstanding Balance
$20,392
Interest Rate
3.9%
Mortgage Type
New Conventional
Estimated Equity
$32,095
Purchase Details
Closed on
Nov 24, 2010
Sold by
Hicks Tammy L
Bought by
Morell Kenneth R and Morell Janeen L
Create a Home Valuation Report for This Property
The Home Valuation Report is an in-depth analysis detailing your home's value as well as a comparison with similar homes in the area
Home Values in the Area
Average Home Value in this Area
Purchase History
| Date | Buyer | Sale Price | Title Company |
|---|---|---|---|
| Peters Nathan | $18,500 | Advanced Title | |
| Morell Kenneth R | -- | -- |
Source: Public Records
Mortgage History
| Date | Status | Borrower | Loan Amount |
|---|---|---|---|
| Open | Peters Nathan | $21,600 |
Source: Public Records
Tax History Compared to Growth
Tax History
| Year | Tax Paid | Tax Assessment Tax Assessment Total Assessment is a certain percentage of the fair market value that is determined by local assessors to be the total taxable value of land and additions on the property. | Land | Improvement |
|---|---|---|---|---|
| 2024 | $303 | $8,030 | $1,400 | $6,630 |
| 2023 | $306 | $7,530 | $1,310 | $6,220 |
| 2022 | $1,631 | $18,170 | $1,260 | $16,910 |
| 2021 | $1,677 | $18,970 | $1,310 | $17,660 |
| 2020 | $1,610 | $18,090 | $1,250 | $16,840 |
| 2019 | $1,689 | $19,100 | $1,320 | $17,780 |
| 2018 | $1,642 | $17,980 | $1,240 | $16,740 |
| 2017 | $1,601 | $16,910 | $1,170 | $15,740 |
| 2016 | $1,604 | $16,450 | $1,140 | $15,310 |
| 2015 | $1,559 | $15,930 | $1,100 | $14,830 |
| 2013 | -- | $16,120 | $1,110 | $15,010 |
Source: Public Records
Map
Nearby Homes