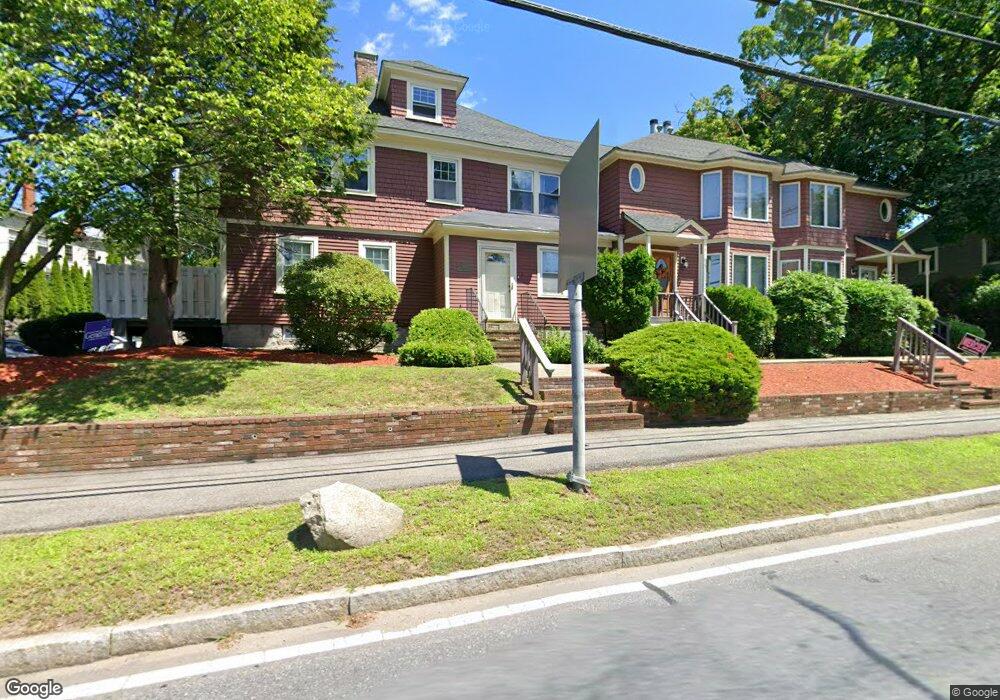
116 Nesmith St Unit 4 Lowell, MA 01852
Belvidere NeighborhoodEstimated Value: $302,000 - $376,000
2
Beds
1
Bath
1,082
Sq Ft
$313/Sq Ft
Est. Value
About This Home
This home is located at 116 Nesmith St Unit 4, Lowell, MA 01852 and is currently estimated at $338,286, approximately $312 per square foot. 116 Nesmith St Unit 4 is a home located in Middlesex County with nearby schools including Moody Elementary School, Abraham Lincoln Elementary School, and Greenhalge Elementary School.
Ownership History
Date
Name
Owned For
Owner Type
Purchase Details
Closed on
Feb 26, 2020
Sold by
Lynch Kevin J and Lynch Daniel
Bought by
Lynch Mary G
Current Estimated Value
Purchase Details
Closed on
Dec 19, 2016
Sold by
Lynch Mary G and Lynch Kevin J
Bought by
Lynch Mary G and Lynch Kevin J
Purchase Details
Closed on
Dec 2, 1994
Sold by
Pershey Edward J and Pershey Monica
Bought by
Lynch Kevin J and Lynch Mary Gail
Home Financials for this Owner
Home Financials are based on the most recent Mortgage that was taken out on this home.
Original Mortgage
$42,000
Interest Rate
8.81%
Mortgage Type
Purchase Money Mortgage
Create a Home Valuation Report for This Property
The Home Valuation Report is an in-depth analysis detailing your home's value as well as a comparison with similar homes in the area
Home Values in the Area
Average Home Value in this Area
Purchase History
| Date | Buyer | Sale Price | Title Company |
|---|---|---|---|
| Lynch Mary G | -- | None Available | |
| Lynch Mary G | -- | -- | |
| Lynch Kevin J | $52,500 | -- |
Source: Public Records
Mortgage History
| Date | Status | Borrower | Loan Amount |
|---|---|---|---|
| Previous Owner | Lynch Kevin J | $20,000 | |
| Previous Owner | Lynch Kevin J | $56,000 | |
| Previous Owner | Lynch Kevin J | $42,000 |
Source: Public Records
Tax History
| Year | Tax Paid | Tax Assessment Tax Assessment Total Assessment is a certain percentage of the fair market value that is determined by local assessors to be the total taxable value of land and additions on the property. | Land | Improvement |
|---|---|---|---|---|
| 2025 | $3,499 | $304,800 | $0 | $304,800 |
| 2024 | $3,298 | $276,900 | $0 | $276,900 |
| 2023 | $3,038 | $244,600 | $0 | $244,600 |
| 2022 | $2,886 | $227,400 | $0 | $227,400 |
| 2021 | $2,739 | $203,500 | $0 | $203,500 |
| 2020 | $2,633 | $197,100 | $0 | $197,100 |
| 2019 | $2,519 | $179,400 | $0 | $179,400 |
| 2018 | $2,370 | $164,700 | $0 | $164,700 |
| 2017 | $2,316 | $155,200 | $0 | $155,200 |
| 2016 | $2,194 | $144,700 | $0 | $144,700 |
| 2015 | $2,110 | $136,300 | $0 | $136,300 |
| 2013 | $2,151 | $143,300 | $0 | $143,300 |
Source: Public Records
Map
Nearby Homes
- 234 Nesmith St Unit 8
- 88 Perry St
- 44 Hanks St
- 200 Rogers St Unit 6
- 80 Rogers St Unit 204
- 313 Nesmith St
- 42 Pentucket Ave
- 254 Pleasant St
- 39 Groves Ave
- 31 Merrill St
- 192 1st St
- 3 Vernon St
- 42 Christian St Unit Lot 17
- 52 Christian St
- 105 3rd St
- 94 1st St Unit 10
- 10 Kearney Square Unit 407
- 25 Read St
- 30 Market St Unit 7
- 9 Central St Unit 601
- 116 Nesmith St Unit 3
- 116 Nesmith St Unit 1
- 15 Clitheroe St
- 130 Nesmith St
- 21 Clitheroe St
- 10 Wyman St
- 10 Wyman St
- 125 Nesmith St
- 125 Nesmith St Unit 1
- 115 Nesmith St Unit 3
- 115 Nesmith St Unit 2
- 115 Nesmith St Unit 1
- 27 Clitheroe St
- 105 Nesmith St Unit C
- 105 Nesmith St Unit A
- 105 Nesmith St Unit 1
- 105 Nesmith St Unit 3
- 56 Oak St
- 56 Oak St Unit 58
- 38 Harrison St
Your Personal Tour Guide
Ask me questions while you tour the home.