Estimated Value: $237,741 - $248,000
3
Beds
2
Baths
1,505
Sq Ft
$161/Sq Ft
Est. Value
About This Home
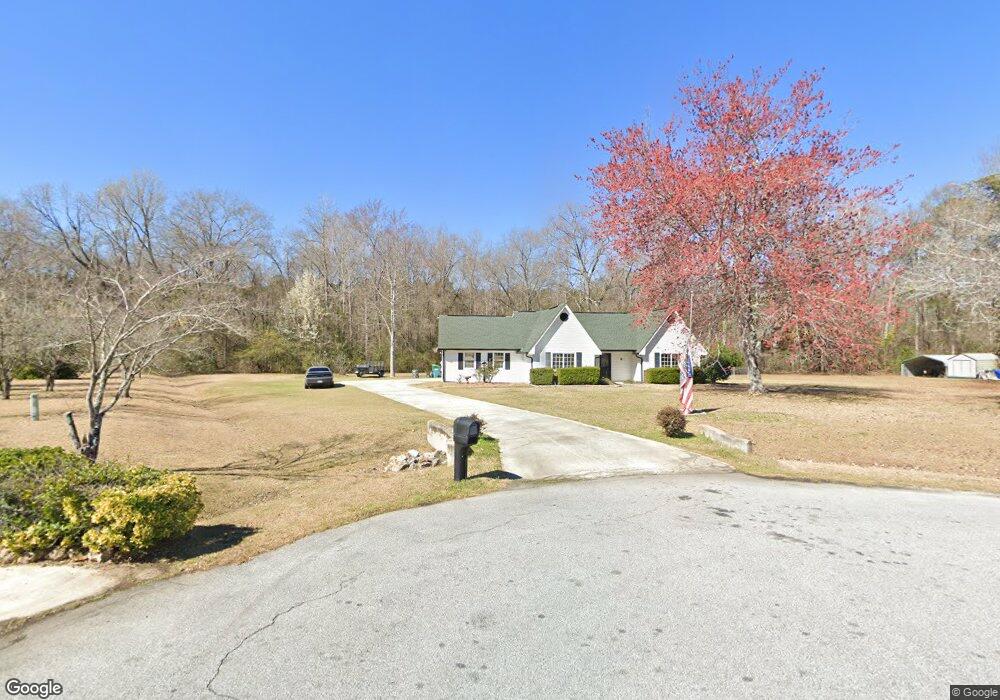
This home is located at 116 Nichole Ct, Perry, GA 31069 and is currently estimated at $242,185, approximately $160 per square foot. 116 Nichole Ct is a home located in Houston County with nearby schools including Langston Road Elementary School, Perry Middle School, and Perry High School.
Ownership History
Date
Name
Owned For
Owner Type
Purchase Details
Closed on
Sep 30, 2013
Sold by
Miller Mark
Bought by
Campbell Jonathan W and Campbell Angela D
Current Estimated Value
Home Financials for this Owner
Home Financials are based on the most recent Mortgage that was taken out on this home.
Original Mortgage
$134,693
Outstanding Balance
$101,329
Interest Rate
4.53%
Mortgage Type
New Conventional
Estimated Equity
$140,856
Purchase Details
Closed on
Apr 21, 2008
Sold by
Conrad Joel A and Conrad Suzanne R
Bought by
Miller Mark and Miller Jolie
Purchase Details
Closed on
Jun 29, 1998
Sold by
Woods Douglas A and Karen E*
Bought by
Conrad Joel A and Suzanne R*
Purchase Details
Closed on
Jan 29, 1988
Sold by
Chester William J and Sutton Dan
Bought by
Woods Douglas A and Karen E*
Purchase Details
Closed on
May 28, 1987
Sold by
Chester William J
Bought by
Chester William J and Sutton Dan R
Create a Home Valuation Report for This Property
The Home Valuation Report is an in-depth analysis detailing your home's value as well as a comparison with similar homes in the area
Home Values in the Area
Average Home Value in this Area
Purchase History
| Date | Buyer | Sale Price | Title Company |
|---|---|---|---|
| Campbell Jonathan W | $132,000 | -- | |
| Miller Mark | $129,900 | None Available | |
| Conrad Joel A | $87,300 | -- | |
| Woods Douglas A | -- | -- | |
| Chester William J | -- | -- |
Source: Public Records
Mortgage History
| Date | Status | Borrower | Loan Amount |
|---|---|---|---|
| Open | Campbell Jonathan W | $134,693 |
Source: Public Records
Tax History
| Year | Tax Paid | Tax Assessment Tax Assessment Total Assessment is a certain percentage of the fair market value that is determined by local assessors to be the total taxable value of land and additions on the property. | Land | Improvement |
|---|---|---|---|---|
| 2024 | $1,527 | $63,840 | $10,000 | $53,840 |
| 2023 | $1,301 | $53,840 | $10,000 | $43,840 |
| 2022 | $1,237 | $51,160 | $10,000 | $41,160 |
| 2021 | $1,147 | $47,200 | $10,000 | $37,200 |
| 2020 | $1,110 | $45,480 | $10,000 | $35,480 |
| 2019 | $1,110 | $45,480 | $10,000 | $35,480 |
| 2018 | $1,110 | $45,480 | $10,000 | $35,480 |
| 2017 | $1,106 | $45,280 | $10,000 | $35,280 |
| 2016 | $1,108 | $45,280 | $10,000 | $35,280 |
| 2015 | $1,110 | $45,280 | $10,000 | $35,280 |
| 2014 | -- | $45,280 | $10,000 | $35,280 |
| 2013 | -- | $45,280 | $10,000 | $35,280 |
Source: Public Records
Map
Nearby Homes
- 238 Lake Joy Rd
- 121 Saraland Trail
- 203 Sugar Creek Trail
- 205 Sugar Creek Trail
- 207 Sugar Creek Trail
- 209 Sugar Creek Trail
- 408 Langston Rd
- 211 Sugar Creek Trail
- 214 Saraland Trail
- 215 Saraland Trail
- 127 Glen Oaks Rd
- 124 Glen Oaks Rd
- 3004 Cellar Ln
- 114 Sutton Dr
- 204 Sutton Dr
- 206 Sutton Dr
- 309 E River Cane Run
- 119 Magnum Way
- Gloria Plan at Lake Forest
- Delilah Plan at Lake Forest
Your Personal Tour Guide
Ask me questions while you tour the home.