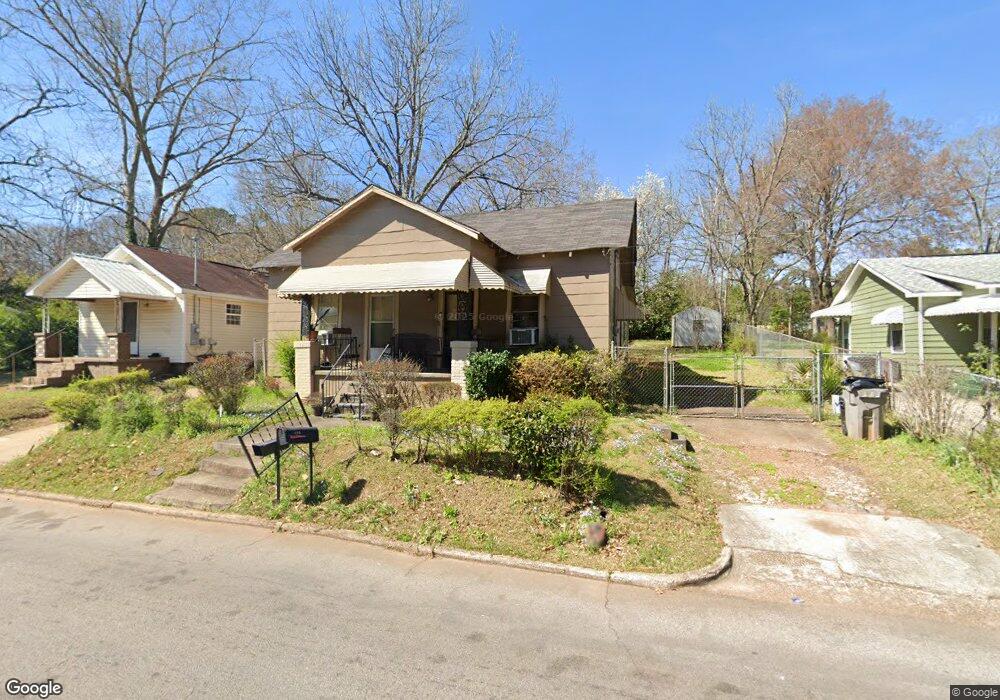
116 North St Lagrange, GA 30240
Estimated Value: $77,000 - $158,000
2
Beds
1
Bath
1,143
Sq Ft
$90/Sq Ft
Est. Value
About This Home
This home is located at 116 North St, Lagrange, GA 30240 and is currently estimated at $103,008, approximately $90 per square foot. 116 North St is a home located in Troup County with nearby schools including Franklin Forest Elementary School, Hollis Hand Elementary School, and Ethel W. Kight Elementary School.
Ownership History
Date
Name
Owned For
Owner Type
Purchase Details
Closed on
Sep 9, 1999
Sold by
Jimmy Rogers
Bought by
Rogers Lucy M
Current Estimated Value
Purchase Details
Closed on
Jan 1, 1969
Sold by
Fuller Rogers
Bought by
Jimmy Rogers
Create a Home Valuation Report for This Property
The Home Valuation Report is an in-depth analysis detailing your home's value as well as a comparison with similar homes in the area
Purchase History
| Date | Buyer | Sale Price | Title Company |
|---|---|---|---|
| Rogers Lucy M | -- | -- | |
| Jimmy Rogers | -- | -- |
Source: Public Records
Tax History
| Year | Tax Paid | Tax Assessment Tax Assessment Total Assessment is a certain percentage of the fair market value that is determined by local assessors to be the total taxable value of land and additions on the property. | Land | Improvement |
|---|---|---|---|---|
| 2025 | $128 | $24,420 | $1,480 | $22,940 |
| 2024 | $127 | $22,724 | $1,480 | $21,244 |
| 2023 | $2 | $15,980 | $1,480 | $14,500 |
| 2022 | $54 | $15,060 | $1,480 | $13,580 |
| 2021 | $23 | $11,932 | $1,480 | $10,452 |
| 2020 | $59 | $11,932 | $1,480 | $10,452 |
| 2019 | $27 | $10,872 | $1,480 | $9,392 |
| 2018 | $28 | $10,892 | $1,500 | $9,392 |
| 2017 | $28 | $10,892 | $1,500 | $9,392 |
| 2016 | $16 | $10,474 | $1,500 | $8,974 |
| 2015 | $17 | $10,474 | $1,500 | $8,974 |
| 2014 | $2 | $10,002 | $1,500 | $8,502 |
| 2013 | -- | $10,664 | $1,500 | $9,164 |
Source: Public Records
Map
Nearby Homes
- 900 North St
- 110 Russell St
- 204 Colonial St
- 806 New Franklin Rd
- 202 Park Hill Dr
- 109 Thomas St
- 102 Dogwood Dr
- 114 Briarcliff Rd
- 219 Banks St
- 222 Beechwood Cir
- 106 Ewing St
- 724 Camellia Dr
- 732 Camellia Dr
- 0 Ridley Ave Unit 10550104
- 609 Ridley Ave
- 707 Ridley Ave
- 611 Ridley Ave
- 615 Ridley Ave
- 709 Ridley Ave
- 134 S Page St
- 118 North St
- 114 North St
- 107 Strickland St
- 120 North St
- 112 North St
- 115 North St
- 109 Strickland St
- 121 North St
- 3472 Highway 29 N
- 108 Strickland St
- 107 North St
- 113 North St
- 111 Strickland St
- 110 Strickland St
- 114 Russell St
- 113 Strickland St
- 107 Russell St
- 118 Russell St
- 112 Strickland St
- 126 North St
Your Personal Tour Guide
Ask me questions while you tour the home.