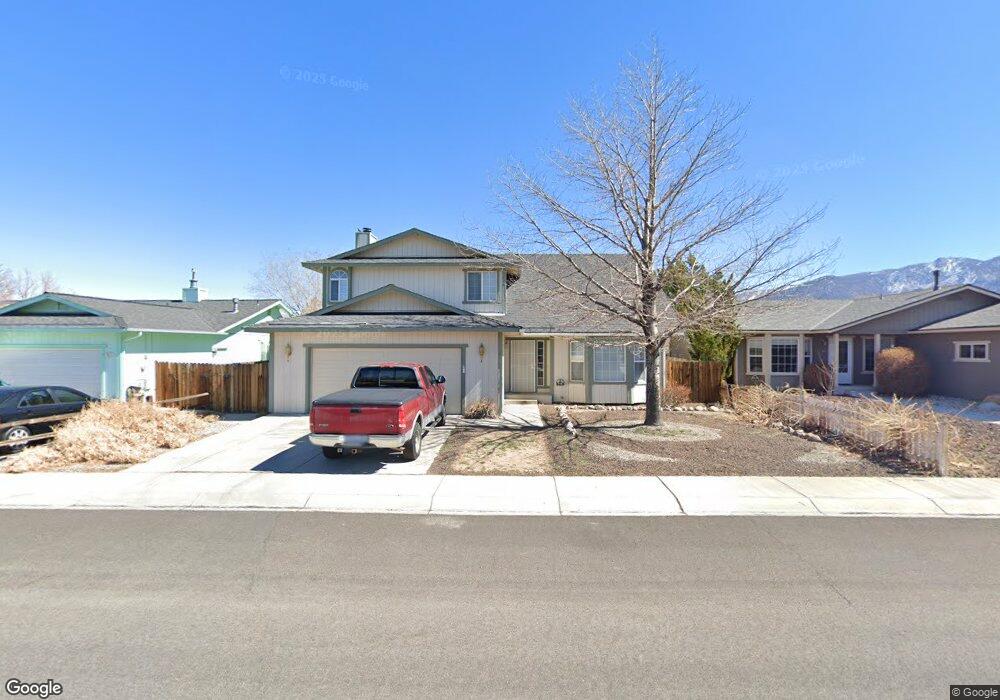
116 Northpointe Cir Dayton, NV 89403
Estimated Value: $434,000 - $481,000
3
Beds
3
Baths
2,066
Sq Ft
$223/Sq Ft
Est. Value
About This Home
This home is located at 116 Northpointe Cir, Dayton, NV 89403 and is currently estimated at $460,000, approximately $222 per square foot. 116 Northpointe Cir is a home located in Lyon County with nearby schools including Dayton Elementary School, Dayton Intermediate School, and Dayton High School.
Ownership History
Date
Name
Owned For
Owner Type
Purchase Details
Closed on
Sep 19, 2022
Sold by
Andrew And Roxanne Lindstrom Family Trus
Bought by
Lindstrom Richard T and Arca Julie A
Current Estimated Value
Home Financials for this Owner
Home Financials are based on the most recent Mortgage that was taken out on this home.
Original Mortgage
$330,000
Outstanding Balance
$316,019
Interest Rate
5.55%
Mortgage Type
New Conventional
Estimated Equity
$143,981
Purchase Details
Closed on
Jul 17, 2020
Sold by
Lindstrom Andrew J and Lindstrom Roxanne M
Bought by
Lindstrom Andrew and Lindstrom Roxanne
Purchase Details
Closed on
Feb 22, 2018
Sold by
Skog Shawn P and Skog Terri S
Bought by
Lindstrom Andrew J and Lindstrom Roxanne M
Home Financials for this Owner
Home Financials are based on the most recent Mortgage that was taken out on this home.
Original Mortgage
$258,250
Interest Rate
4.22%
Mortgage Type
FHA
Create a Home Valuation Report for This Property
The Home Valuation Report is an in-depth analysis detailing your home's value as well as a comparison with similar homes in the area
Home Values in the Area
Average Home Value in this Area
Purchase History
| Date | Buyer | Sale Price | Title Company |
|---|---|---|---|
| Lindstrom Richard T | $430,000 | First Centennial Title | |
| Lindstrom Andrew | -- | None Available | |
| Lindstrom Andrew J | $250,000 | First Centennial Reno |
Source: Public Records
Mortgage History
| Date | Status | Borrower | Loan Amount |
|---|---|---|---|
| Open | Lindstrom Richard T | $330,000 | |
| Previous Owner | Lindstrom Andrew J | $258,250 |
Source: Public Records
Tax History
| Year | Tax Paid | Tax Assessment Tax Assessment Total Assessment is a certain percentage of the fair market value that is determined by local assessors to be the total taxable value of land and additions on the property. | Land | Improvement |
|---|---|---|---|---|
| 2025 | $2,340 | $118,365 | $59,500 | $58,865 |
| 2024 | $2,272 | $119,041 | $59,500 | $59,540 |
| 2023 | $2,272 | $115,678 | $59,500 | $56,178 |
| 2022 | $1,884 | $111,606 | $59,500 | $52,106 |
| 2021 | $1,744 | $105,331 | $54,250 | $51,081 |
| 2020 | $1,614 | $94,586 | $45,500 | $49,086 |
| 2019 | $1,513 | $86,002 | $38,500 | $47,502 |
| 2018 | $1,441 | $71,156 | $24,500 | $46,656 |
| 2017 | $1,383 | $59,432 | $12,600 | $46,832 |
| 2016 | $1,348 | $54,404 | $6,300 | $48,104 |
| 2015 | $1,345 | $42,134 | $6,300 | $35,834 |
| 2014 | $1,306 | $41,417 | $6,300 | $35,117 |
Source: Public Records
Map
Nearby Homes
- 435 La Costa Cir
- 107 Finney St
- 520 Stonehaven Ct
- 357 Bayhill Cir
- 02968239 Dayton Valley Rd
- 198 McMarlin
- 302 Royal Troon Dr
- 357 Royal Troon Dr
- 103 Hillcrest Cir
- 349 Bayhill Cir Unit 2
- 262 Cruden Bay Dr
- 110 Finney St
- 236 La Costa Ave
- 531 Stonehaven Ct
- 648 St Andrews Dr
- 400 Pebble Beach Ct
- 694 Saint Andrews Dr
- 696 Saint Andrews Dr
- 410 Pebble Beach Ct
- 504 Doral Ct
- 116 N Pointe Cir
- 114 N Pointe Cir
- 118 Northpointe Cir
- 114 Northpointe Cir
- 118 N Pointe Cir
- 213 Alpine Dr
- 215 Alpine Dr
- 112 Northpointe Cir
- 120 Northpointe Cir
- 115 N Pointe Cir
- 115 Northpointe Cir
- 217 Alpine Dr
- 209 Alpine Dr
- 119 N Pointe Cir
- 119 Northpointe Cir
- 122 Northpointe Cir
- 110 Northpointe Cir
- 110 N Pointe Cir
- 111 Northpointe Cir
- 219 Alpine Dr
Your Personal Tour Guide
Ask me questions while you tour the home.