Estimated Value: $327,000 - $329,008
3
Beds
3
Baths
2,613
Sq Ft
$126/Sq Ft
Est. Value
About This Home
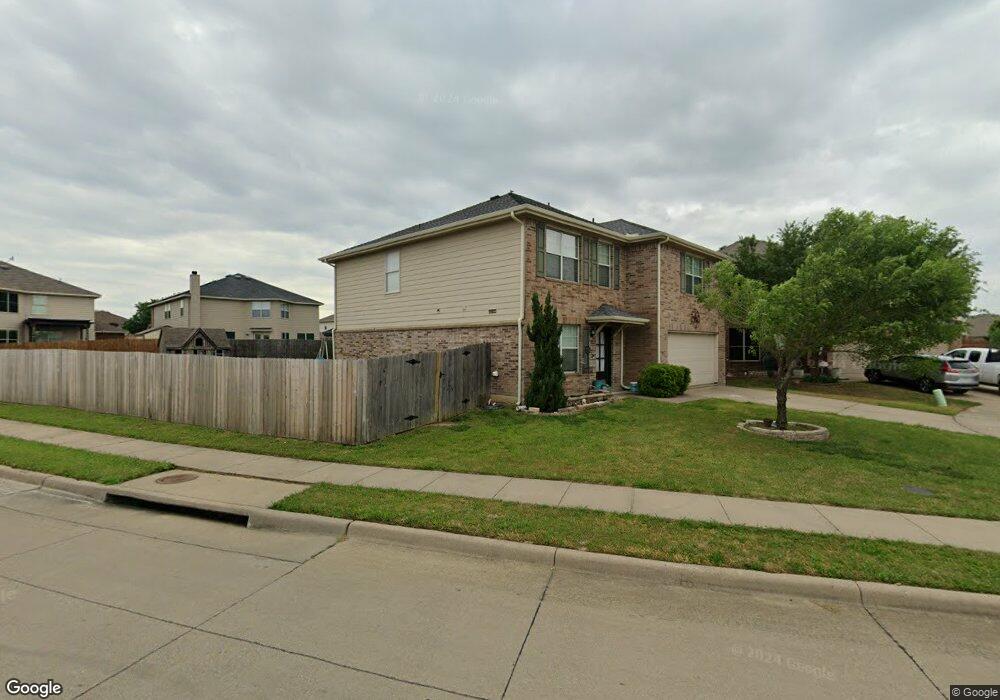
This home is located at 116 Patriot Pkwy, Venus, TX 76084 and is currently estimated at $328,004, approximately $125 per square foot. 116 Patriot Pkwy is a home located in Ellis County with nearby schools including J A Vitovsky Elementary School and Frank Seale Middle School.
Ownership History
Date
Name
Owned For
Owner Type
Purchase Details
Closed on
Nov 5, 2012
Sold by
Morris Justin Michael
Bought by
Morris Sarah Elizabeth
Current Estimated Value
Purchase Details
Closed on
Nov 10, 2009
Sold by
Fannie Mae
Bought by
Morris Justin M
Home Financials for this Owner
Home Financials are based on the most recent Mortgage that was taken out on this home.
Original Mortgage
$102,996
Outstanding Balance
$67,458
Interest Rate
5.06%
Mortgage Type
FHA
Estimated Equity
$260,546
Purchase Details
Closed on
Aug 4, 2009
Sold by
Worley Jeanna and Worley Joel
Bought by
Fannie Mae and Federal National Mortgage Association
Purchase Details
Closed on
Dec 27, 2007
Sold by
Hmh Lifestyles Lp
Bought by
Worley Joel and Worley Jeanna
Home Financials for this Owner
Home Financials are based on the most recent Mortgage that was taken out on this home.
Original Mortgage
$131,378
Interest Rate
6.07%
Mortgage Type
New Conventional
Purchase Details
Closed on
Sep 12, 2007
Sold by
Jabez Development Lp
Bought by
Hmh Lifestyles Lp
Create a Home Valuation Report for This Property
The Home Valuation Report is an in-depth analysis detailing your home's value as well as a comparison with similar homes in the area
Home Values in the Area
Average Home Value in this Area
Purchase History
| Date | Buyer | Sale Price | Title Company |
|---|---|---|---|
| Morris Sarah Elizabeth | -- | None Available | |
| Morris Justin M | -- | -- | |
| Fannie Mae | $133,210 | -- | |
| Worley Joel | -- | -- | |
| Hmh Lifestyles Lp | -- | None Available |
Source: Public Records
Mortgage History
| Date | Status | Borrower | Loan Amount |
|---|---|---|---|
| Open | Morris Justin M | $102,996 | |
| Previous Owner | Worley Joel | $131,378 |
Source: Public Records
Tax History Compared to Growth
Tax History
| Year | Tax Paid | Tax Assessment Tax Assessment Total Assessment is a certain percentage of the fair market value that is determined by local assessors to be the total taxable value of land and additions on the property. | Land | Improvement |
|---|---|---|---|---|
| 2025 | $2,235 | $296,543 | -- | -- |
| 2024 | $2,235 | $269,585 | -- | -- |
| 2023 | $2,235 | $245,077 | $0 | $0 |
| 2022 | $3,544 | $222,797 | $0 | $0 |
| 2021 | $5,061 | $228,940 | $28,880 | $200,060 |
| 2020 | $4,972 | $184,130 | $26,250 | $157,880 |
| 2019 | $4,739 | $169,845 | $0 | $0 |
| 2018 | $2,579 | $169,845 | $20,000 | $149,845 |
| 2017 | $4,675 | $165,000 | $20,000 | $145,000 |
| 2016 | $4,382 | $154,650 | $20,000 | $134,650 |
| 2015 | $3,789 | $151,220 | $20,000 | $131,220 |
| 2014 | $3,789 | $150,090 | $0 | $0 |
Source: Public Records
Map
Nearby Homes
- 106 Rushmore Ln
- 122 Presidents Way
- 103 Presidents Way
- 149 Jefferson Dr
- 147 Washington Way
- 146 Independence Ave
- 161 Kennedy Dr
- 137 Jefferson Dr
- 133 Adams Ave
- 111 Lady Bird Ct
- 106 Lady Bird Ct
- 127 Independence Ave
- 180 Kennedy Dr
- 208 Liberty Ln
- 118 Washington Way
- 109 Independence Ave
- 111 Rebel Rd
- 107 Kennedy Dr
- 116 Austin Ave
- 191 Presidents Way
- 118 Patriot Pkwy
- 104 Colonial Ln
- 106 Colonial Ln
- 102 Colonial Ln
- 115 Patriot Pkwy
- 113 Patriot Pkwy
- 117 Patriot Pkwy
- 120 Patriot Pkwy
- 100 Colonial Ln
- 175 Washington Way
- 173 Washington Way
- 111 Patriot Pkwy
- 119 Patriot Pkwy
- 121 Patriot Pkwy
- 169 Washington Way
- 109 Patriot Pkwy
- 171 Washington Way
- 167 Washington Way
- 114 Presidents Way
- 112 Presidents Way