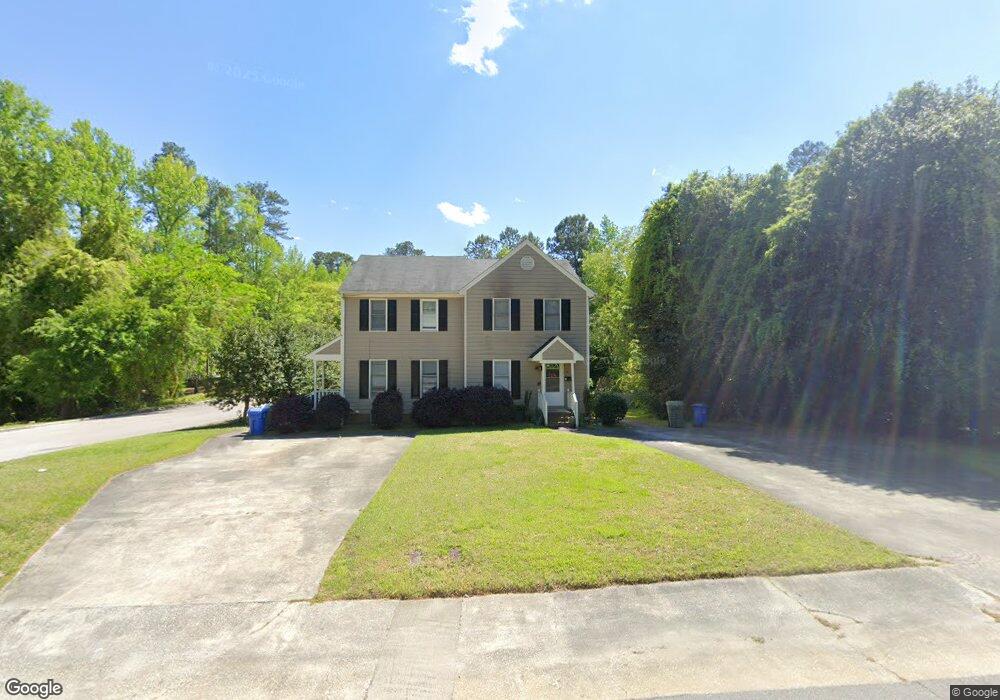
116 Pine St Fuquay-Varina, NC 27526
Estimated Value: $409,544 - $521,000
2
Beds
2
Baths
1,080
Sq Ft
$437/Sq Ft
Est. Value
About This Home
This home is located at 116 Pine St, Fuquay-Varina, NC 27526 and is currently estimated at $472,386, approximately $437 per square foot. 116 Pine St is a home located in Wake County with nearby schools including Fuquay-Varina High, Achievement Charter Academy, and Southern Wake Academy.
Ownership History
Date
Name
Owned For
Owner Type
Purchase Details
Closed on
Mar 17, 2022
Sold by
Walker Street Llc
Bought by
Nernom 1 Llc
Current Estimated Value
Purchase Details
Closed on
May 30, 2017
Sold by
Gallo Frank A and Gallo Catherine K
Bought by
Walker Street Llc
Purchase Details
Closed on
Oct 18, 2012
Bought by
Gallo Frank A and Gallo Catherine K
Purchase Details
Closed on
Nov 23, 2007
Sold by
Holleman Edythe W and Giles Teresa F
Bought by
Akins Properties Llc
Home Financials for this Owner
Home Financials are based on the most recent Mortgage that was taken out on this home.
Original Mortgage
$120,000
Interest Rate
6.36%
Mortgage Type
Seller Take Back
Purchase Details
Closed on
Apr 2, 2002
Sold by
Turner Thomas E and Turner Linda C
Bought by
Holleman Edythe W and Giles Teresa F
Create a Home Valuation Report for This Property
The Home Valuation Report is an in-depth analysis detailing your home's value as well as a comparison with similar homes in the area
Home Values in the Area
Average Home Value in this Area
Purchase History
| Date | Buyer | Sale Price | Title Company |
|---|---|---|---|
| Nernom 1 Llc | $450,000 | Hall Duane R | |
| Walker Street Llc | $155,000 | None Available | |
| Gallo Frank A | $147,500 | -- | |
| Akins Properties Llc | $150,000 | None Available | |
| Holleman Edythe W | $123,000 | -- |
Source: Public Records
Mortgage History
| Date | Status | Borrower | Loan Amount |
|---|---|---|---|
| Previous Owner | Akins Properties Llc | $120,000 |
Source: Public Records
Tax History Compared to Growth
Tax History
| Year | Tax Paid | Tax Assessment Tax Assessment Total Assessment is a certain percentage of the fair market value that is determined by local assessors to be the total taxable value of land and additions on the property. | Land | Improvement |
|---|---|---|---|---|
| 2025 | $3,213 | $362,636 | $105,000 | $257,636 |
| 2024 | $3,200 | $362,636 | $105,000 | $257,636 |
| 2023 | $2,543 | $225,045 | $48,000 | $177,045 |
| 2022 | $2,391 | $225,045 | $48,000 | $177,045 |
| 2021 | $2,279 | $225,045 | $48,000 | $177,045 |
| 2020 | $2,279 | $225,045 | $48,000 | $177,045 |
| 2019 | $2,008 | $170,616 | $38,400 | $132,216 |
| 2018 | $1,894 | $170,616 | $38,400 | $132,216 |
| 2017 | $1,827 | $170,616 | $38,400 | $132,216 |
| 2016 | $1,802 | $170,616 | $38,400 | $132,216 |
| 2015 | $1,742 | $170,274 | $45,600 | $124,674 |
| 2014 | $1,680 | $170,274 | $45,600 | $124,674 |
Source: Public Records
Map
Nearby Homes
- 602 S Main St
- 200 Old Spring Hill Ln
- 70 Saintsbury Dr
- 56 Saintsbury Dr
- 501 E Spring St
- 1008 S Fieldhaven Dr
- 1612 S Main St
- 1014 S Main St
- 409 E Vance St
- 432 Barn View Ct
- 1012 S Willhaven Dr
- 509 Timber Meadow Lake Dr
- 1024 S Philwood Ct
- 201 S Ennis St
- 306 Country Side Way
- 318 Country Side Way
- 77 Saintsbury Dr
- 63 Saintsbury Dr
- 2200 Astride Way
- 912 Field Ivy Dr