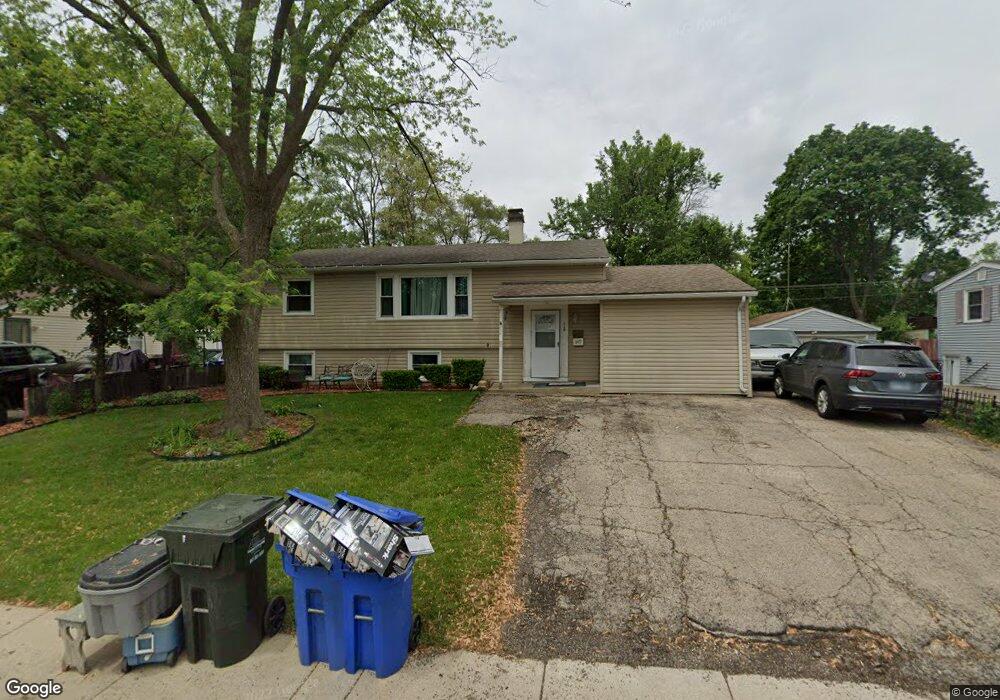
116 Pueblo Rd Carpentersville, IL 60110
Estimated Value: $240,000 - $293,000
4
Beds
--
Bath
1,950
Sq Ft
$137/Sq Ft
Est. Value
About This Home
This home is located at 116 Pueblo Rd, Carpentersville, IL 60110 and is currently estimated at $266,192, approximately $136 per square foot. 116 Pueblo Rd is a home located in Kane County with nearby schools including Perry Elementary School, Crescent City Grade School, and Carpentersville Middle School.
Ownership History
Date
Name
Owned For
Owner Type
Purchase Details
Closed on
Feb 28, 2024
Sold by
Loschiavo Scott and Loschiavo Claudia
Bought by
Sanchez Jennifer
Current Estimated Value
Home Financials for this Owner
Home Financials are based on the most recent Mortgage that was taken out on this home.
Original Mortgage
$200,000
Outstanding Balance
$196,655
Interest Rate
6.6%
Mortgage Type
New Conventional
Estimated Equity
$69,537
Purchase Details
Closed on
Dec 6, 1996
Sold by
Harrington Lorraine J
Bought by
Loschiavo Scott and Loschiavo Claudia
Home Financials for this Owner
Home Financials are based on the most recent Mortgage that was taken out on this home.
Original Mortgage
$91,973
Interest Rate
7.85%
Mortgage Type
FHA
Create a Home Valuation Report for This Property
The Home Valuation Report is an in-depth analysis detailing your home's value as well as a comparison with similar homes in the area
Home Values in the Area
Average Home Value in this Area
Purchase History
| Date | Buyer | Sale Price | Title Company |
|---|---|---|---|
| Sanchez Jennifer | $211,000 | None Listed On Document | |
| Loschiavo Scott | $92,500 | -- |
Source: Public Records
Mortgage History
| Date | Status | Borrower | Loan Amount |
|---|---|---|---|
| Open | Sanchez Jennifer | $200,000 | |
| Previous Owner | Loschiavo Scott | $91,973 |
Source: Public Records
Tax History Compared to Growth
Tax History
| Year | Tax Paid | Tax Assessment Tax Assessment Total Assessment is a certain percentage of the fair market value that is determined by local assessors to be the total taxable value of land and additions on the property. | Land | Improvement |
|---|---|---|---|---|
| 2024 | $5,801 | $76,597 | $12,553 | $64,044 |
| 2023 | $5,791 | $68,920 | $11,295 | $57,625 |
| 2022 | $5,393 | $61,932 | $11,295 | $50,637 |
| 2021 | $5,297 | $58,476 | $10,665 | $47,811 |
| 2020 | $4,674 | $57,161 | $10,425 | $46,736 |
| 2019 | $4,566 | $54,264 | $9,897 | $44,367 |
| 2018 | $4,357 | $49,901 | $9,701 | $40,200 |
| 2017 | $4,173 | $46,680 | $9,075 | $37,605 |
| 2016 | $3,821 | $40,728 | $8,787 | $31,941 |
| 2015 | -- | $32,844 | $8,234 | $24,610 |
| 2014 | -- | $29,373 | $8,007 | $21,366 |
| 2013 | -- | $30,272 | $8,252 | $22,020 |
Source: Public Records
Map
Nearby Homes
- 200 Amarillo Dr
- 105 Siesta Rd
- 308 Amarillo Ct
- 1426 Kings Rd
- 2013 Silverstone Dr Unit 2013
- 1431 Silverstone Dr Unit 1416
- 140 Hickory Dr
- 1811 IL Rte 25 (Elgin) Rd
- 2245 Flagstone Ln Unit 155
- 1309 Silverstone Dr Unit 1305
- 1303 Silverstone Dr Unit 1302
- 713 Silverstone Dr Unit 77
- 103 Hickory Dr
- 171 Lake Shore Dr
- 1551 Glacier Trail Unit 644
- 336 Delaware St
- 7 Autumn Trail
- 944 Cortney Dr
- 149 Austin Ave
- 181 Skyline Dr