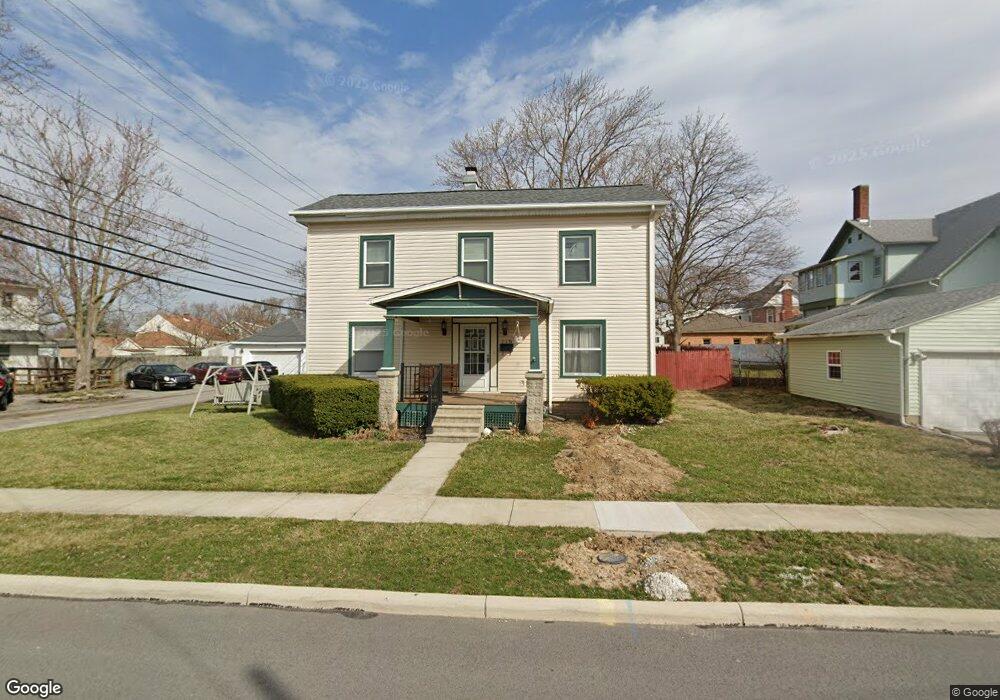
116 Rector Ave Findlay, OH 45840
Estimated Value: $206,000 - $239,106
4
Beds
2
Baths
2,684
Sq Ft
$85/Sq Ft
Est. Value
About This Home
This home is located at 116 Rector Ave, Findlay, OH 45840 and is currently estimated at $228,277, approximately $85 per square foot. 116 Rector Ave is a home located in Hancock County with nearby schools including Northview Elementary School, Bigelow Hill Elementary School, and Glenwood Middle School.
Ownership History
Date
Name
Owned For
Owner Type
Purchase Details
Closed on
Apr 21, 1986
Bought by
Seng John D and Seng Debra E
Current Estimated Value
Create a Home Valuation Report for This Property
The Home Valuation Report is an in-depth analysis detailing your home's value as well as a comparison with similar homes in the area
Home Values in the Area
Average Home Value in this Area
Purchase History
| Date | Buyer | Sale Price | Title Company |
|---|---|---|---|
| Seng John D | $56,000 | -- |
Source: Public Records
Tax History
| Year | Tax Paid | Tax Assessment Tax Assessment Total Assessment is a certain percentage of the fair market value that is determined by local assessors to be the total taxable value of land and additions on the property. | Land | Improvement |
|---|---|---|---|---|
| 2024 | $2,064 | $58,090 | $6,620 | $51,470 |
| 2023 | $2,067 | $58,090 | $6,620 | $51,470 |
| 2022 | $2,059 | $58,090 | $6,620 | $51,470 |
| 2021 | $1,611 | $39,590 | $6,630 | $32,960 |
| 2020 | $1,611 | $39,590 | $6,630 | $32,960 |
| 2019 | $1,579 | $39,590 | $6,630 | $32,960 |
| 2018 | $1,432 | $32,950 | $5,300 | $27,650 |
| 2017 | $716 | $32,950 | $5,300 | $27,650 |
| 2016 | $1,419 | $32,950 | $5,300 | $27,650 |
| 2015 | $1,337 | $30,570 | $5,300 | $25,270 |
| 2014 | $1,337 | $30,570 | $5,300 | $25,270 |
| 2012 | $1,444 | $32,770 | $5,300 | $27,470 |
Source: Public Records
Map
Nearby Homes
- 146 Clifton Ave
- 140 Monroe Ave
- 232 Prentiss Ave
- 239 Edith Ave
- 145 Madison Ave
- 315 W Melrose Ave
- 329 W Melrose Ave
- 421 Clifton Ave
- 2400 Hollybrook Dr
- 528 Rector Ave
- 241 Stanley Ave
- 206 Midland Ave
- 245 Edinborough Dr
- 2604 N Main St
- 301 Allen Ave
- 400 Rosewood Ave
- 1820 Gayle Ln
- 636 W Melrose Ave
- 322 Midland Ave
- 701 W Melrose Ave
Your Personal Tour Guide
Ask me questions while you tour the home.