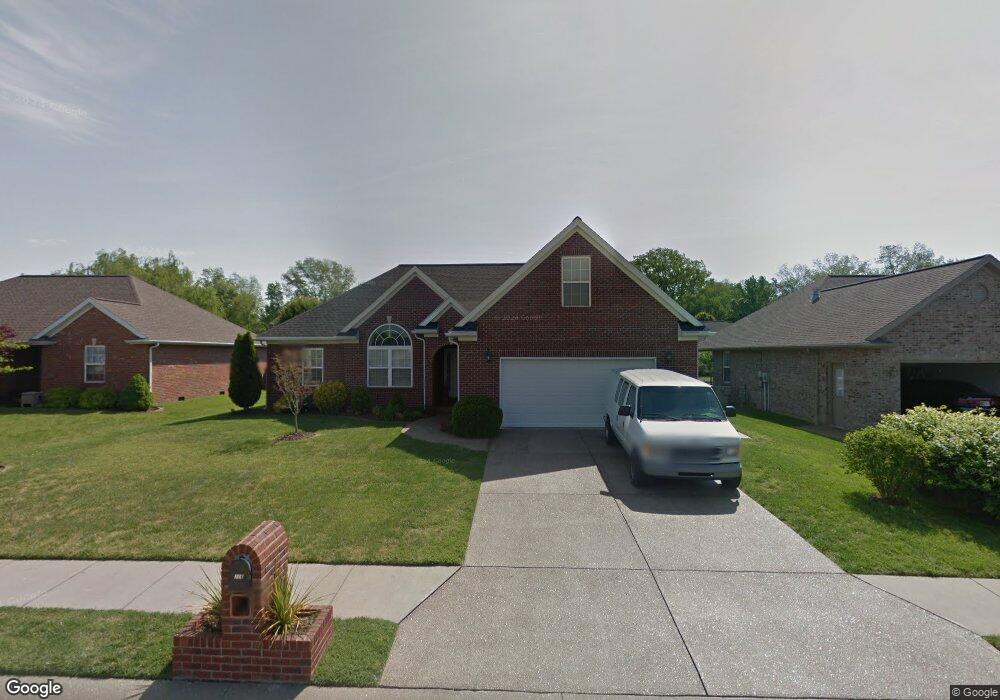
116 Reston Newburgh, IN 47630
Estimated Value: $299,000 - $344,000
4
Beds
2
Baths
2,122
Sq Ft
$150/Sq Ft
Est. Value
About This Home
This home is located at 116 Reston, Newburgh, IN 47630 and is currently estimated at $317,756, approximately $149 per square foot. 116 Reston is a home located in Warrick County with nearby schools including Newburgh Elementary School, Castle North Middle School, and Castle High School.
Ownership History
Date
Name
Owned For
Owner Type
Purchase Details
Closed on
Jun 8, 2016
Sold by
Barbara Anne Kinred
Bought by
Gilmore Ian and Gilmore Daisy
Current Estimated Value
Home Financials for this Owner
Home Financials are based on the most recent Mortgage that was taken out on this home.
Original Mortgage
$102,000
Outstanding Balance
$80,317
Interest Rate
3.66%
Estimated Equity
$237,439
Purchase Details
Closed on
Mar 22, 2010
Sold by
Doyon Nicolas
Bought by
Jones Neal T and Jones Carolyn Jones
Home Financials for this Owner
Home Financials are based on the most recent Mortgage that was taken out on this home.
Original Mortgage
$129,375
Interest Rate
5.02%
Mortgage Type
New Conventional
Purchase Details
Closed on
Jun 13, 2008
Sold by
Dmello Richard G and Dmello Reshma R
Bought by
Doyon Nicolas
Home Financials for this Owner
Home Financials are based on the most recent Mortgage that was taken out on this home.
Original Mortgage
$147,650
Interest Rate
6.04%
Mortgage Type
New Conventional
Create a Home Valuation Report for This Property
The Home Valuation Report is an in-depth analysis detailing your home's value as well as a comparison with similar homes in the area
Home Values in the Area
Average Home Value in this Area
Purchase History
| Date | Buyer | Sale Price | Title Company |
|---|---|---|---|
| Gilmore Ian | -- | -- | |
| Jones Neal T | -- | None Available | |
| Doyon Nicolas | -- | None Available |
Source: Public Records
Mortgage History
| Date | Status | Borrower | Loan Amount |
|---|---|---|---|
| Open | Gilmore Ian | $102,000 | |
| Closed | Gilmore Ian | -- | |
| Previous Owner | Jones Neal T | $129,375 | |
| Previous Owner | Doyon Nicolas | $147,650 |
Source: Public Records
Tax History
| Year | Tax Paid | Tax Assessment Tax Assessment Total Assessment is a certain percentage of the fair market value that is determined by local assessors to be the total taxable value of land and additions on the property. | Land | Improvement |
|---|---|---|---|---|
| 2025 | $2,813 | $297,400 | $41,000 | $256,400 |
| 2024 | $2,813 | $281,300 | $41,000 | $240,300 |
| 2023 | $2,675 | $280,300 | $41,000 | $239,300 |
| 2022 | $2,594 | $259,400 | $28,500 | $230,900 |
| 2021 | $2,064 | $207,500 | $22,300 | $185,200 |
| 2020 | $1,969 | $198,100 | $22,300 | $175,800 |
| 2019 | $1,945 | $193,100 | $21,700 | $171,400 |
| 2018 | $1,901 | $188,700 | $21,700 | $167,000 |
| 2017 | $1,822 | $180,700 | $21,700 | $159,000 |
| 2016 | $1,765 | $175,000 | $21,700 | $153,300 |
| 2014 | $1,761 | $178,800 | $22,200 | $156,600 |
| 2013 | $1,541 | $165,500 | $22,200 | $143,300 |
Source: Public Records
Map
Nearby Homes
- 712 Maple Ln
- 213 Westbriar Blvd
- 511 Westbriar Cir
- 439 Westbriar Cir
- 35 Cir
- 9655 Arlington Ct
- 5633 Byerson Dr
- 0 Phelps Dr
- 1 Yorkshire Dr
- 9998 Monte Way
- 422 W Water St
- 413 W Main St
- 408 W Water St
- 5902 Lisa Ln
- 223 W Jennings St
- 626 Monroe St
- 10177 Kimberly Ln
- 8633 Copper Creek Dr
- 110 Monroe St
- 5125 Primrose Ct
Your Personal Tour Guide
Ask me questions while you tour the home.