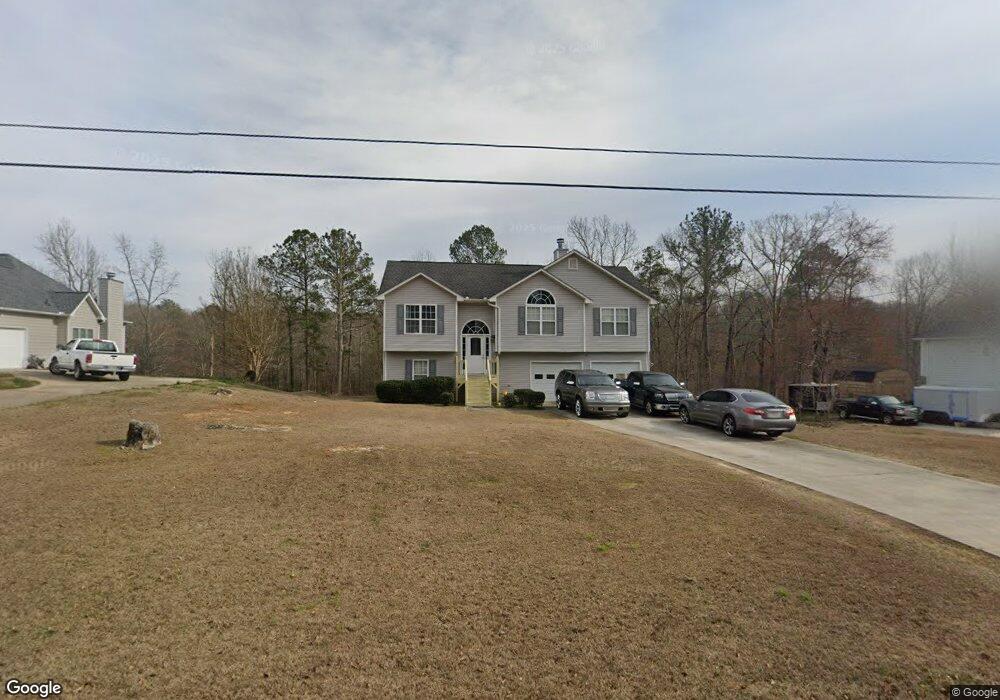
116 River Oak Ct Temple, GA 30179
Estimated Value: $259,000 - $329,000
3
Beds
2
Baths
1,308
Sq Ft
$222/Sq Ft
Est. Value
About This Home
This home is located at 116 River Oak Ct, Temple, GA 30179 and is currently estimated at $290,973, approximately $222 per square foot. 116 River Oak Ct is a home located in Carroll County with nearby schools including Temple Elementary School, Temple Middle School, and Temple High School.
Ownership History
Date
Name
Owned For
Owner Type
Purchase Details
Closed on
Jan 29, 2008
Sold by
Residential Funding Co Llc
Bought by
Mitchell Derek J
Current Estimated Value
Home Financials for this Owner
Home Financials are based on the most recent Mortgage that was taken out on this home.
Original Mortgage
$103,377
Outstanding Balance
$64,319
Interest Rate
6.06%
Mortgage Type
FHA
Estimated Equity
$226,654
Purchase Details
Closed on
Sep 4, 2007
Sold by
Littles Tameshia
Bought by
Residential Funding Co Llc
Purchase Details
Closed on
Jun 13, 2003
Sold by
Gentry Homes & Dev Inc
Bought by
Littles Tameisha
Purchase Details
Closed on
Oct 25, 2002
Sold by
Southern Value Homes
Bought by
Gentry Homes & Dev Inc
Purchase Details
Closed on
Dec 23, 1998
Sold by
Little Tallapoosa
Bought by
Southern Value Homes
Create a Home Valuation Report for This Property
The Home Valuation Report is an in-depth analysis detailing your home's value as well as a comparison with similar homes in the area
Home Values in the Area
Average Home Value in this Area
Purchase History
| Date | Buyer | Sale Price | Title Company |
|---|---|---|---|
| Mitchell Derek J | $105,000 | -- | |
| Residential Funding Co Llc | $105,000 | -- | |
| Residential Fundinf Co Llc | $103,700 | -- | |
| Littles Tameisha | $146,300 | -- | |
| Gentry Homes & Dev Inc | $18,500 | -- | |
| Southern Value Homes | $250,000 | -- |
Source: Public Records
Mortgage History
| Date | Status | Borrower | Loan Amount |
|---|---|---|---|
| Open | Mitchell Derek J | $103,377 |
Source: Public Records
Tax History
| Year | Tax Paid | Tax Assessment Tax Assessment Total Assessment is a certain percentage of the fair market value that is determined by local assessors to be the total taxable value of land and additions on the property. | Land | Improvement |
|---|---|---|---|---|
| 2025 | $2,611 | $116,738 | $12,000 | $104,738 |
| 2024 | $2,910 | $128,623 | $12,000 | $116,623 |
| 2023 | $2,910 | $117,984 | $12,000 | $105,984 |
| 2022 | $2,435 | $97,090 | $12,000 | $85,090 |
| 2021 | $1,812 | $70,690 | $12,000 | $58,690 |
| 2020 | $1,637 | $63,782 | $12,000 | $51,782 |
| 2019 | $1,566 | $60,511 | $12,000 | $48,511 |
| 2018 | $1,206 | $45,924 | $6,000 | $39,924 |
| 2017 | $1,210 | $45,924 | $6,000 | $39,924 |
| 2016 | $1,210 | $45,924 | $6,000 | $39,924 |
| 2015 | $1,259 | $45,008 | $12,000 | $33,008 |
| 2014 | $1,264 | $45,008 | $12,000 | $33,008 |
Source: Public Records
Map
Nearby Homes
- 360 S Red Oak Way
- 400 Bar J Rd
- 196 Lakeridge Dr
- 396 Lakeridge Dr
- 566 Clinton Dr
- 702 Miller Ct
- 840 Windy Mill Ct
- 1162 E Highway 78
- 528 Clinton Dr
- 0 Bar J Rd Unit 10578558
- 0 Bar J Rd Unit 7627694
- 408 Reagan Dr
- 145 Gentle Breeze Ct
- 10 Leslie Ln
- 159 Villa Rosa Ridge
- 108 Villa Rosa Ridge
- 143 Autumn Run Place
- 126 Old Villa Rica Rd
- 85 Taylors Gin Rd
- 10 S Villa Rd
- 130 River Oak Ct
- 102 River Oak Ct
- 150 River Oak Ct
- 209 River Oak Ct
- 90 River Oak Ct
- 78 River Oak Ct
- 103 River Oak Ct
- 91 River Oak Ct
- 288 Rio Rancho Dr Unit 110
- 288 Rio Rancho Dr
- 145 River Oak Ct
- 66 River Oak Ct
- 285 Rio Rancho Dr
- 79 River Oak Ct
- 162 River Oak Ct
- 157 River Oak Ct
- 67 River Oak Ct
- 174 River Oak Ct
- 56 River Oak Ct
- 190 River Oak Ct
Your Personal Tour Guide
Ask me questions while you tour the home.