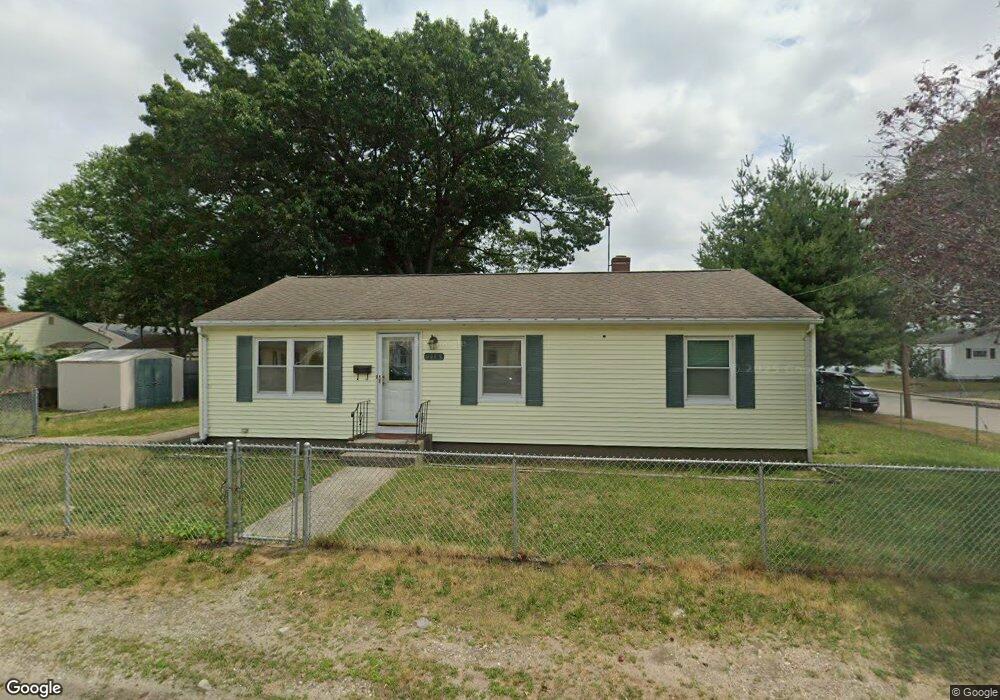
116 Rocco Ave Pawtucket, RI 02860
Beverage Hill-The Plains NeighborhoodEstimated Value: $376,000 - $413,000
5
Beds
2
Baths
1,644
Sq Ft
$238/Sq Ft
Est. Value
About This Home
This home is located at 116 Rocco Ave, Pawtucket, RI 02860 and is currently estimated at $390,774, approximately $237 per square foot. 116 Rocco Ave is a home located in Providence County with nearby schools including International Charter School, Saint Teresa Catholic Elementary School, and Saint Raphael Academy.
Ownership History
Date
Name
Owned For
Owner Type
Purchase Details
Closed on
Jul 1, 2003
Sold by
Cross Kerwin J and Cross Charlene V
Bought by
Audate Gina D and Audate Bonaventure
Current Estimated Value
Home Financials for this Owner
Home Financials are based on the most recent Mortgage that was taken out on this home.
Original Mortgage
$131,900
Outstanding Balance
$56,239
Interest Rate
5.53%
Estimated Equity
$334,535
Purchase Details
Closed on
Feb 25, 2000
Sold by
Elderkin Josephine H and Elderkin Herbert P
Bought by
Cross Kerwin J and Cross Charlene V
Home Financials for this Owner
Home Financials are based on the most recent Mortgage that was taken out on this home.
Original Mortgage
$90,629
Interest Rate
8.15%
Create a Home Valuation Report for This Property
The Home Valuation Report is an in-depth analysis detailing your home's value as well as a comparison with similar homes in the area
Home Values in the Area
Average Home Value in this Area
Purchase History
| Date | Buyer | Sale Price | Title Company |
|---|---|---|---|
| Audate Gina D | $165,000 | -- | |
| Cross Kerwin J | $93,000 | -- |
Source: Public Records
Mortgage History
| Date | Status | Borrower | Loan Amount |
|---|---|---|---|
| Open | Cross Kerwin J | $131,900 | |
| Previous Owner | Cross Kerwin J | $125,000 | |
| Previous Owner | Cross Kerwin J | $94,000 | |
| Previous Owner | Cross Kerwin J | $90,629 |
Source: Public Records
Tax History
| Year | Tax Paid | Tax Assessment Tax Assessment Total Assessment is a certain percentage of the fair market value that is determined by local assessors to be the total taxable value of land and additions on the property. | Land | Improvement |
|---|---|---|---|---|
| 2025 | $3,934 | $299,200 | $131,900 | $167,300 |
| 2024 | $3,692 | $299,200 | $131,900 | $167,300 |
| 2023 | $3,852 | $227,400 | $80,200 | $147,200 |
| 2022 | $3,770 | $227,400 | $80,200 | $147,200 |
| 2021 | $3,770 | $227,400 | $80,200 | $147,200 |
| 2020 | $3,532 | $169,100 | $60,600 | $108,500 |
| 2019 | $3,532 | $169,100 | $60,600 | $108,500 |
| 2018 | $3,404 | $169,100 | $60,600 | $108,500 |
| 2017 | $3,358 | $147,800 | $46,700 | $101,100 |
| 2016 | $3,235 | $147,800 | $46,700 | $101,100 |
| 2015 | $3,235 | $147,800 | $46,700 | $101,100 |
| 2014 | $3,157 | $136,900 | $46,700 | $90,200 |
Source: Public Records
Map
Nearby Homes
- 33 Dover St
- 68 Maryland Ave
- 62 York Ave
- 11 Crane St
- 84 Farrell St
- 23 Fortin Ave
- 333 School St Unit 109
- 275 Columbus Ave
- 71 Birchland Ave
- 70 Brewster St
- 38 Ashburne St
- 100 Pond St
- 339 Beverage Hill Ave
- 40 Rosemere Rd
- 146 S Bend St
- 60 Nassau St
- 70 Manistee St
- 400 Newport Ave
- 359 Williston Way
- 66 State St
Your Personal Tour Guide
Ask me questions while you tour the home.